Authors: Tanya Clement, Steve McLaughlin, David Tcheng, Loretta Auvil, Tony Borries
Category: Paper:Long Paper
Keywords: Audio user interfaces; data mining; machine learning; infrastructure development; Sound studies
ARLO (Adaptive Recognition with Layered Optimization): a Prototype for High Performance Analysis of Sound Collections in the Humanities
1. Introduction
Beyond simple annotation and visualization tools or expensive proprietary software, open access software for accessing and analyzing audio is not widely available for general use by the humanities community. Speech recognition algorithms in projects such as MALACH (Multilingual Access to Large spoken ArCHives) are often not built as Web-accessible interfaces for broader audiences. Analysis and visualization software such as PRAAT, which is used by linguists, and Sonic Visualizer, which is often used by music scholars, are desktop tools that typically allow users to focus on one file at a time, making project-sharing difficult for collaborative research and classroom projects. In bioacoustics, researchers use Raven (from the Cornell Lab of Ornithology) and Avisoft (expensive, proprietary software), which perform well with clean data from a single animal. Most of these tools are either not used in multiple domains or with large collections and none of them do well with noise or with multiple signals. As a result of these factors, humanists have few opportunities to use advanced technologies for analyzing large, messy sound archives. In response to this lack, the School of Information (iSchool) at the University of Texas at Austin (UT) and the Illinois Informatics Institute (I3) at the University of Illinois at Urbana-Champaign (UIUC) are collaborating on the HiPSTAS (High Performance Sound Technologies for Access and Scholarship) project. A primary goal of HiPSTAS is to develop a research environment that uses machine learning and visualization to automate processes for describing unprocessed spoken word collections of keen interest to humanists.
This paper describes how we have developed, as a result of HiPSTAS, a machine learning system called ARLO (Adaptive Recognition with Layered Optimization) to help deal with the information challenges that scholars encounter in their attempt to do research with unprocessed audio collections.
2. ARLO (Adaptive Recognition with Layered Optimization) Software
ARLO was developed with UIUC seed funding for avian ecologist David Enstrom (2008) to begin exploring the use of machine learning for data analysis in the fields of animal behavior and ecology. ARLO software was chosen as the software we would develop through HiPSTAS primarily because it extracts basic prosodic features such as pitch, rhythm, and timbre that humanities scholars have called significant for performing analysis with sound collections (Bernstein, 2011; Sherwood, 2006; Tsur, 1992).
2.1. Filter Bank Signal Processing and Spectrogram Generation
ARLO analyzes audio by extracting features based on time and frequency information in the form of a spectrogram. The spectrogram is computed using band-pass filters linked with energy detectors. The filter bank approach is similar to using an array of tuning forks, each positioned at a separate frequency, an approach that is thought to best mimic the processes of the human ear (Salthouse and Sarpeshkar). With filter banks, users can optimize the trade-off between time and frequency resolutions in the spectrograms (Rossing, 2001) by choosing a frequency range and ‘damping factor’ (or damping ratio), a parameter that determines how long the tuning forks ‘ring.’ By selecting these features, users can optimize their searches for a given sound. For these reasons,
2.2. Machine-Learning Examples and the ARLO API (Application Programming Interface)
In ARLO, examples for machine learning are audio events that the user has identified and labeled. Audio events comprise a start and end time such as a two-second clip, as well as an optional minimum and maximum frequency band to isolate the region of interest. Users label the examples of interest (e.g., “applause” or “barking”). Other control parameters such as damping factor are also provided for creating spectrograph data according to optimal resolutions for a given problem. The algorithm described below retrieves the features of the tag according to the user's chosen spectra and framing size (e.g., two frames per second, each 0.5 seconds) from the audio file through the ARLO API.
2.3. ARLO Machine-Learning Algorithms: IBL (Instance-Based Learning)
The ARLO IBL algorithm finds matches by taking each known classified example and “sliding” it across new audio files looking for good matches based on a distance metric. The average of the weighted training set classes determines prediction probability. The number of match positions considered per second is adjustable and is set to the spectral sample rate. In addition to simple spectra matching, a user can isolate pitch and volume traces, compute correlations on them, and weight the different feature types when computing the overall match strength. This allows the user to weight spectral information that might correspond to such aspects as pitch or rhythm. In the IBL algorithm, accuracy is measured using a simulation of the leave-one-out cross-validation prediction process described above.
3. Use Case: Finding Applause in PennSound Poetry Performances
Humanities scholars have identified the sound of applause as a significant signpost for finding patterns of interest in recorded poetry performances. Applause can serve as a delimiter between performances, indicating how a file can be segmented and indexed. Applause can also serve as a delimiter between the introduction to a performance and the moment when a performance has ended and a question-and-answer period has begun, both of which indicate contextual information such as the presence of people who might not appear in traditional metadata fields (Clement and McLaughlin, 2015). A means for quantifying the presence of applause can also lead researchers to consider more in-depth studies concerning the relationship between audience responses and a poet’s performance of the same poem at different venues as well as the differing responses of audiences at the same venue over the course of a poet’s career or perhaps as a point of comparison between poets. Examples of these results are described below.
For this use case, we ingested approximately 30,257 files remaining (5374.89 hours) from PennSound into ARLO. We chose 2,000 files at random, manually examined them for instances of applause, and chose one instance of applause per recording until we had an example training set of 852 three-second tags, including 582 3-second instances of non-applause (3492 0.5-second examples) and 270 3-second instances of applause (1620 0.5-second examples). Optimization for the IBL test went through 100 iterations. As a result of this optimization process, we used the following parameters for both tests: 0.5-second spectral resolution; 0.5 damping factor; 0.8 weighting power (for IBL); 600 Hz minimum frequency; 5000 Hz maximum frequency; 64 (IBL) and 256 (Weka) spectral bands; spectral sampling rate of 2 (i.e., half-second resolution).
3.1. Preliminary Results
We first evaluated our models using cross-validation on the training data. Using the leave-one-out approach, the IBL classifier achieved an overall accuracy of 94.52% with a 0.5 cut-off classification threshold. After comparing 676 configurations, we found that the optimal approach was using IBL with Hann smoothing over 14 windows (7 seconds). The accuracy for this configuration was 99.41%.
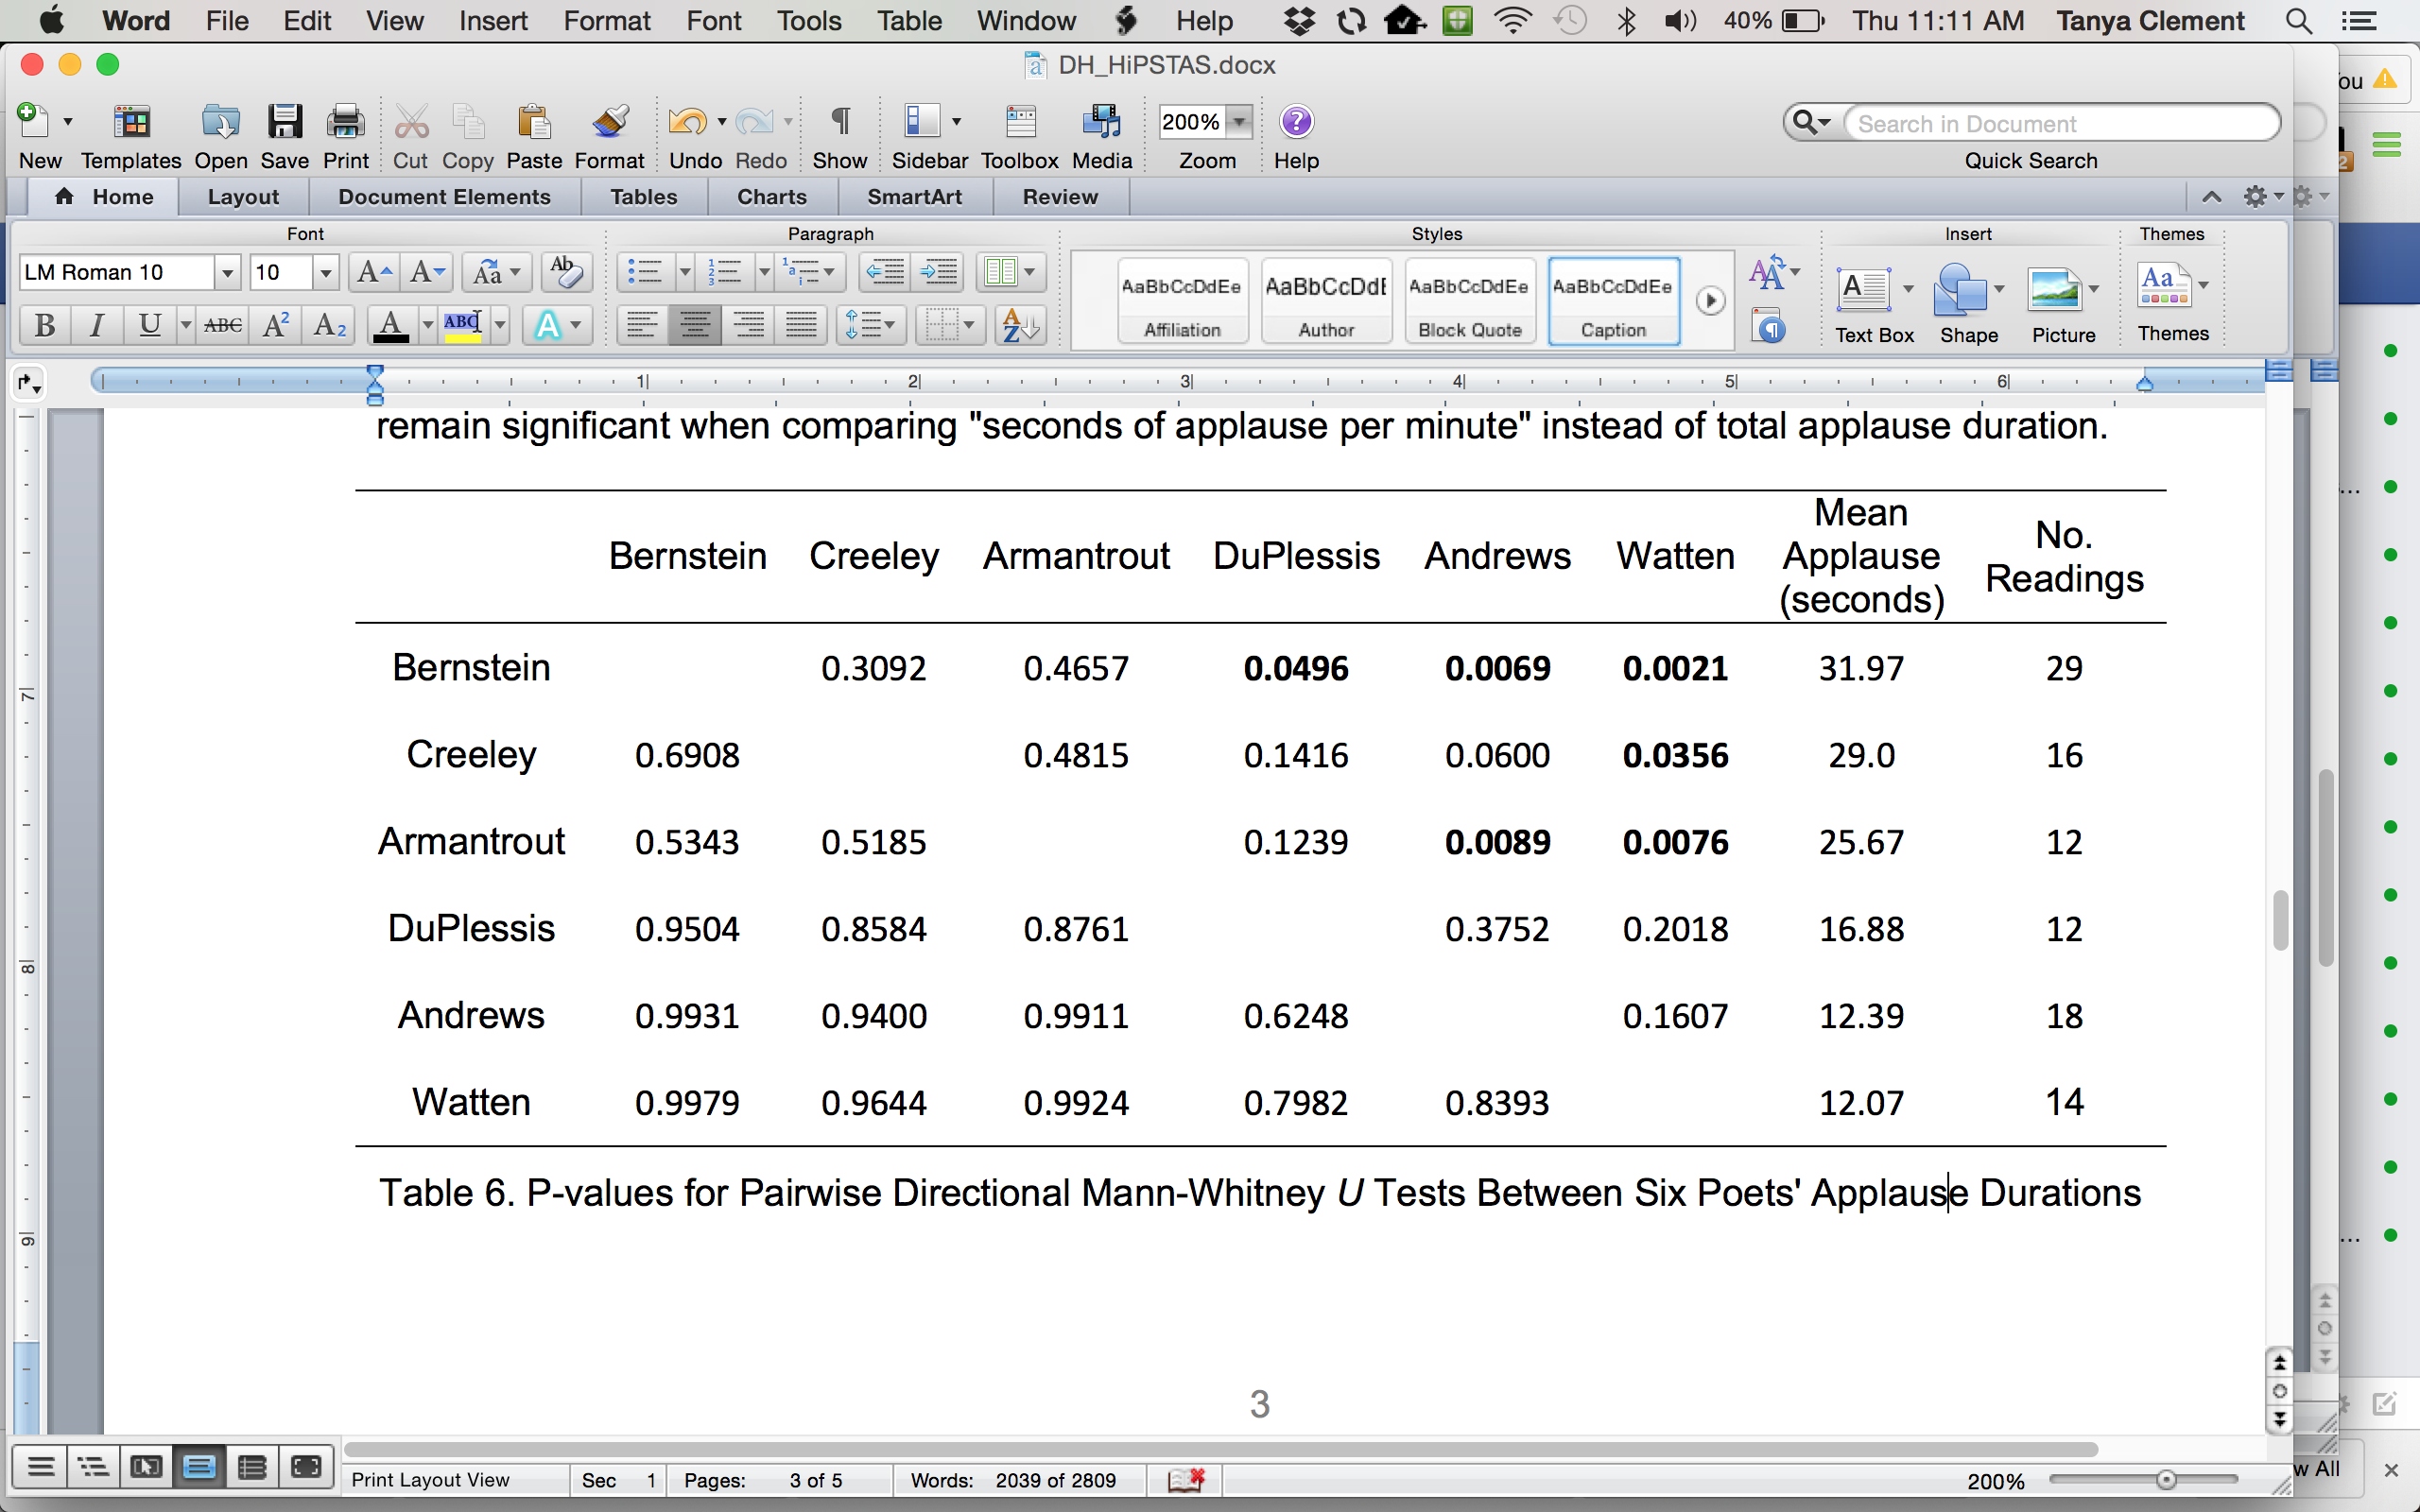
In our initial analysis of classification data, we identified significant differences between measured applause durations for six poets, each with more than ten readings in the evaluation set. Table 6 presents the results of pairwise single-tailed Mann-Whitney (Mann and Whitney, 1947) U tests of applause durations that have been predicted by our IBL classifier. The alternative hypothesis states that the performer in the left column tends to receive more applause than the corresponding one listed in the top row. Results that are significant at the p<0.05 level appear in bold, with the counts and overall means of each set of observations provided in the right two columns. It appears, for instance, that the poet Rae Armantrout tends to receive more applause than either Bruce Andrews or Barrett Watten. These two differences remain significant when comparing "seconds of applause per minute" instead of total applause duration.
4. Discussion and Future Work
This is preliminary work in an ongoing attempt to create a virtual research environment for analyzing large collections of audio. These data warrant further scrutiny, however, since multiple factors might be skewing the results. First, recording technologies have changed over time and as a result some earlier recordings likely include more noise and thus more false positives. Second, editing practices and event formats can vary widely between venues and over time. Finally, recordings that are included in the PennSound archive represent curation decisions that may favor certain kinds of performers over others. Part of the challenge is to determine what use such analysis might serve for scholars in the humanities and in other fields. Some of the HiPSTAS participants have written about their experiences using ARLO in their research (MacArthur, 2015; Mustazza, 2015; Sherwood, 2015; Rettberg, 2015), but we are interested in feedback from multiple user communities including linguists and scientists who have recorded too much sound data for traditional forms of analysis and processing (Servick, 2014). Furthermore, the IBL algorithm produced promising results, but could be improved with more training data, for example. Or, in extended experiments in which users wish to increase the accuracy of the model, we could develop a voting mechanism on the predictions by comparing the models. Users could validate newly identified examples and include them as new training examples, building each model again on the new data. We are currently working on further testing the models and developing a means for these iterative approaches.
- Bernstein, C. (2011). Attack of the Difficult Poems: Essays and Inventions. Chicago: University Of Chicago Press.
- Bioacoustics Research Program. (2014). Raven Pro: Interactive Sound Analysis Software (Version 1.5). Ithaca, NY: The Cornell Lab of Ornithology.
- Boersma, P. (2001). Praat, a system for doing phonetics by computer. Glot International, 5(9/10): 341-45.
- Cannam, C., Landone, C. and Sandler, M. (2010). Sonic Visualiser: An Open Source Application for Viewing, Analysing, and Annotating Music Audio Files. In Proceedings of the ACM Multimedia 2010 International Conference.
- Council on Library and Information Resources and the Library of Congress. (2010). The State of Recorded Sound Preservation in the United States: A National Legacy at Risk in the Digital Age. Washington DC: National Recording Preservation Board of the Library of Congress.
- Enstrom, D. A. and Ward, M. P. (2008). Sex specific song repertoires in Northern Cardinals: mutual assessment and the occurrence of female song. The 12 International Behavioral Ecology Meetings, Ithaca, NY.
- Greene, M. A. and Meissner, D. (2005). More Product, Less Process: Revamping Traditional Archival Processing. The American Archivist, 68(2): 208–63.
- Hall, M., et al. (2009). The WEKA Data Mining Software: An Update. SIGKDD Explorations, 11(1).
- MacArthur, M. (2015). Monotony, the Churches of Poetry Reading, and Sound Studies. PMLA. Forthcoming.
- Mann, H. B. and Whitney, D. R. (1947). On a Test of Whether One of Two Random Variables is Stochastically Larger than the Other. The Annals of Mathematical Statistics, 18(1): 50–60.
- Mustazza, C. (2015) The noise is the content: Toward computationally determining the provenance of poetry recordings using ARLO. Jacket2. Retrieved from https://jacket2.org/commentary/noise-content-toward-computationallydetermining-provenance-poetry-recordings
- Nelson-Strauss, B., Gevinson, A. and Brylawski, S. (2012). The Library of Congress National Recording Preservation Plan. Washington, DC: Library of Congress.
- Powers, D. M. W. (2011). Evaluation: From Precision, Recall and F-Measure to ROC, Informedness, Markedness and Correlation. Journal of Machine Learning Technologies, 2(1): 37–63.
- Rettberg, E. (2015). Hearing the Audience. Jacket2, 26. Retrieved from http://jacket2.org/commentary/hearing-audience.
- R Core Team (2014). R: A language and environment for statistical computing. R Foundation for Statistical Computing, Vienna, Austria. Retrieved from http://www.R-project.org
- Rossing, T. D., and Moore, F. R. (2001). The Science of Sound (3rd edition.), San Francisco: Addison-Wesley.
- Salthouse, C. D. and Sarpeshkar, R. (2003). A Practical Micropower Programmable Bandpass Filter for Use in Bionic Ears. IEEE Journal Of Solid-State Circuits, 38(1): 63-70.
- Servick, K. (2014). Eavesdropping on Ecosystems. Science Magazine. doi: 343.6173: 834–837.
- Sherwood, K. (2006). Elaborate Versionings: Characteristics of Emergent Performance in Three Print/Oral/ Aural Poets. In Oral Tradition, 21(1): 119-47.
- Sherwood, K. (2015). Distanced sounding: ARLO as a tool for the analysis and visualization of versioning phenomena within poetry audio. Jacket2. Retrieved from https://jacket2.org/commentary/distanced-sounding-arlo-toolanalysis-and-visualization-versioning-phenomena-within-poetr.
- Smith, A., Allen, D. R. and Allen, K. (2004). Survey of the State of Audio Collections in Academic Libraries. Washington, DC: Council on Library and Information Resources.
- Tsur, R. (1992). What Makes Sound Patterns Expressive?: The Poetic Mode of Speech Perception. Duke University Press.