Authors: Martin Grandjean
Category: Paper:Short Paper
Keywords: distant reading, archives, intellectual history, data visualization, social network analysis
Archives Distant Reading: Mapping the Activity of the League of Nations’ Intellectual Cooperation
1. Introduction
Founded in 1922 by the League of Nations upon observation that the pacification of Europe may benefit from a better collaboration between scientific elites, the International Committee on Intellectual Cooperation (ICIC) is responsible for coordinating the restructuration of knowledge circulation. Bringing together leading researchers at the height of their career, such as Albert Einstein, Marie Curie and George Hale, chaired by Henri Bergson, the Committee weaves a complex network between transnational scientific institutions and societies, congresses and individuals (Pernet, 2014).
This paper proposes an analysis of the work and functioning of the organization between 1919 and 1927 by setting up a database containing metadata of thousands of documents contained by the ICIC funds (United Nations Archives, Geneva). Visualized as a network of 3.200 people (tens of thousands of relationships), this work provides a new understanding of the internal organization of the Intellectual Cooperation, as well as completely new insights about its relations with the rest of the scientific and diplomatic world. In particular, we will show the necessity to compare the “micro” structure of relationships as mapped by the archive with the “macro” formal structure of the institution. Do the thousands of documents, in a distant reading approach (Moretti, 2013), confirm the internal organization of the League of Nations or do they show individuals/communities that bypass the official hierarchy?
As an opening to an epistemological debate, this research questions the relationship between the researcher, the database and its sources: are the metadata of an archive corpus usable information, regardless of their unique qualitative content? More technically, it also addresses the issue of data visualization and modeling in the historical sciences.
2. Sources
Initially launched in 1922 as a consultative commission, the ICIC quickly mobilized the major part of the International Bureaux section secretariat (upon its stabilization a few years later as a permanent commission), resulting in the production of very vast archives. In the period covered by our study, 1919-1927, which can be qualified as the start-up years of the dynamics of intellectual cooperation in Europe and the World, the funds contain 27.000 documents, mostly internal and external correspondence, about the main missions of the commission: university relations, bibliography coordination, educational matters and various enquiries.
3. Methodology
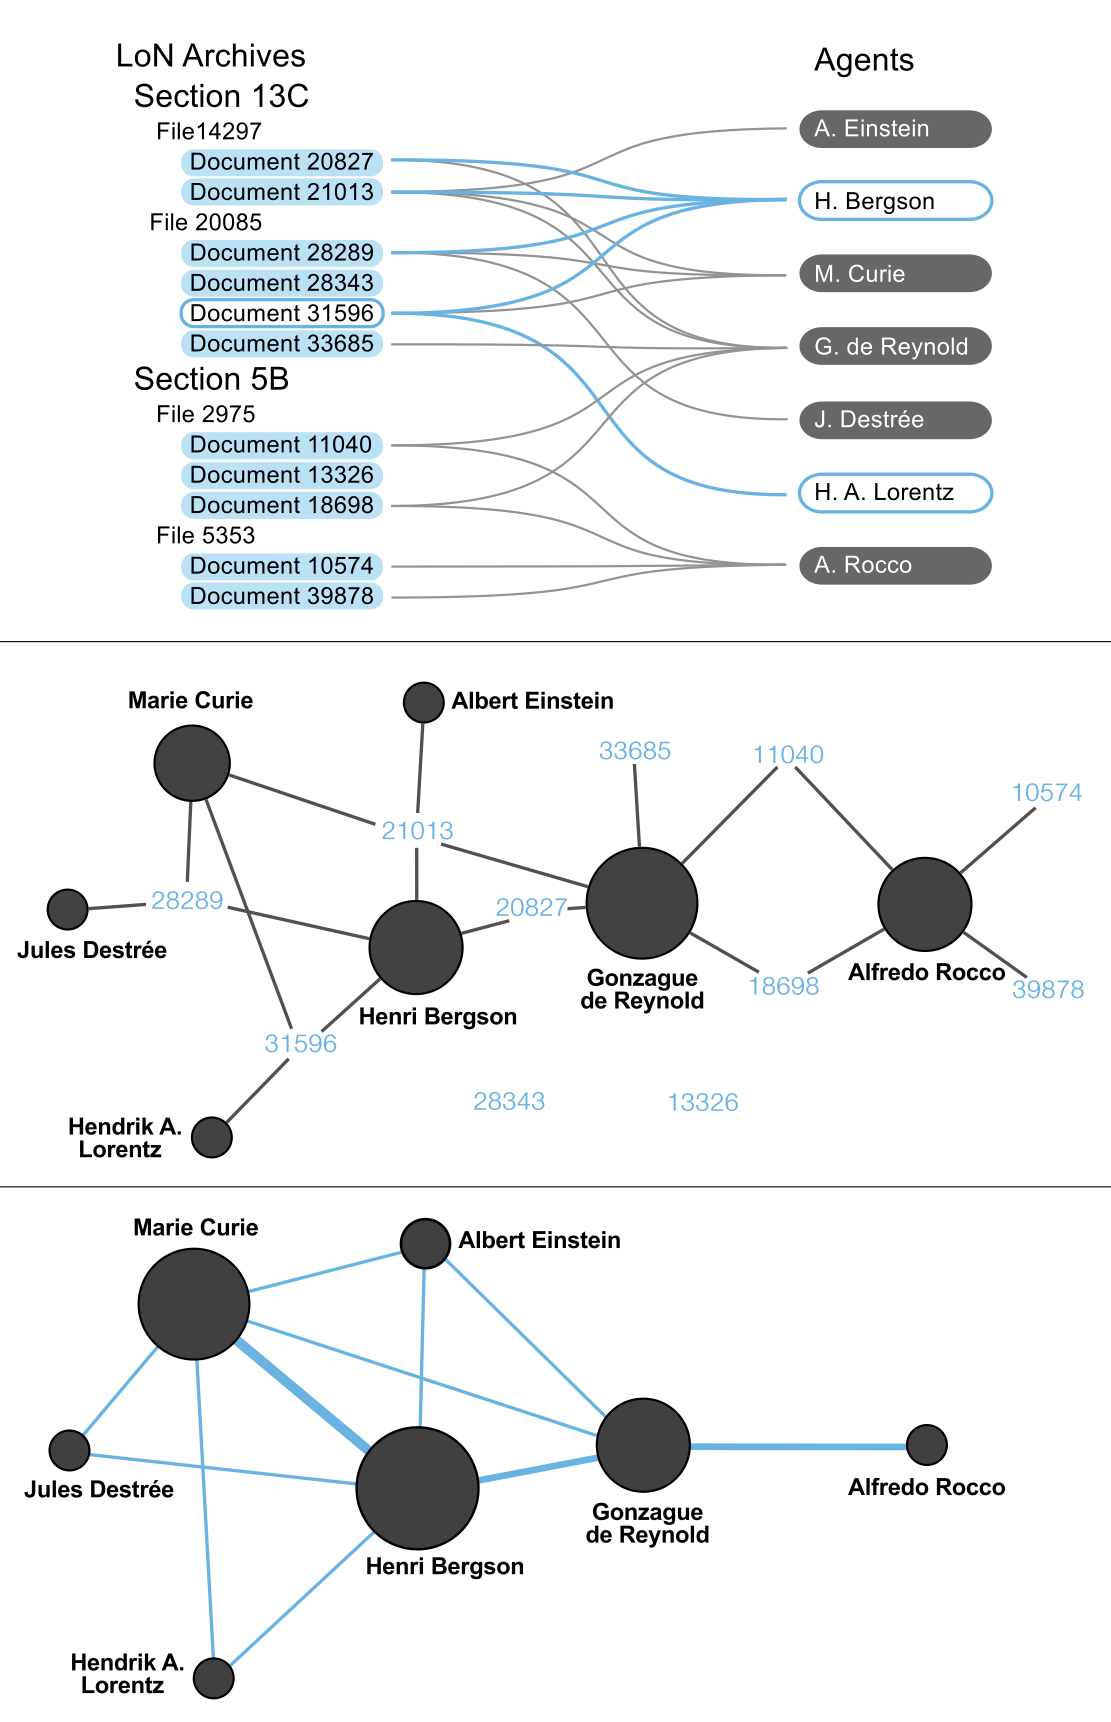
We are particularly interested in individuals who are personally concerned by the documents. Firstly, we indexed all the documents by creating a relational database (fig.1) of all "agents" (senders and receivers). In order to analyze the co-occurrences of agents in the same document, the database, displayed as a 2-mode network (fig.2), is projected onto a 1-mode network (fig.3). Each of the 3.200 agents are connected to its co-occurring by an edge whose weight reflects the intensity of the relationship.
4. Data analysis and visualization
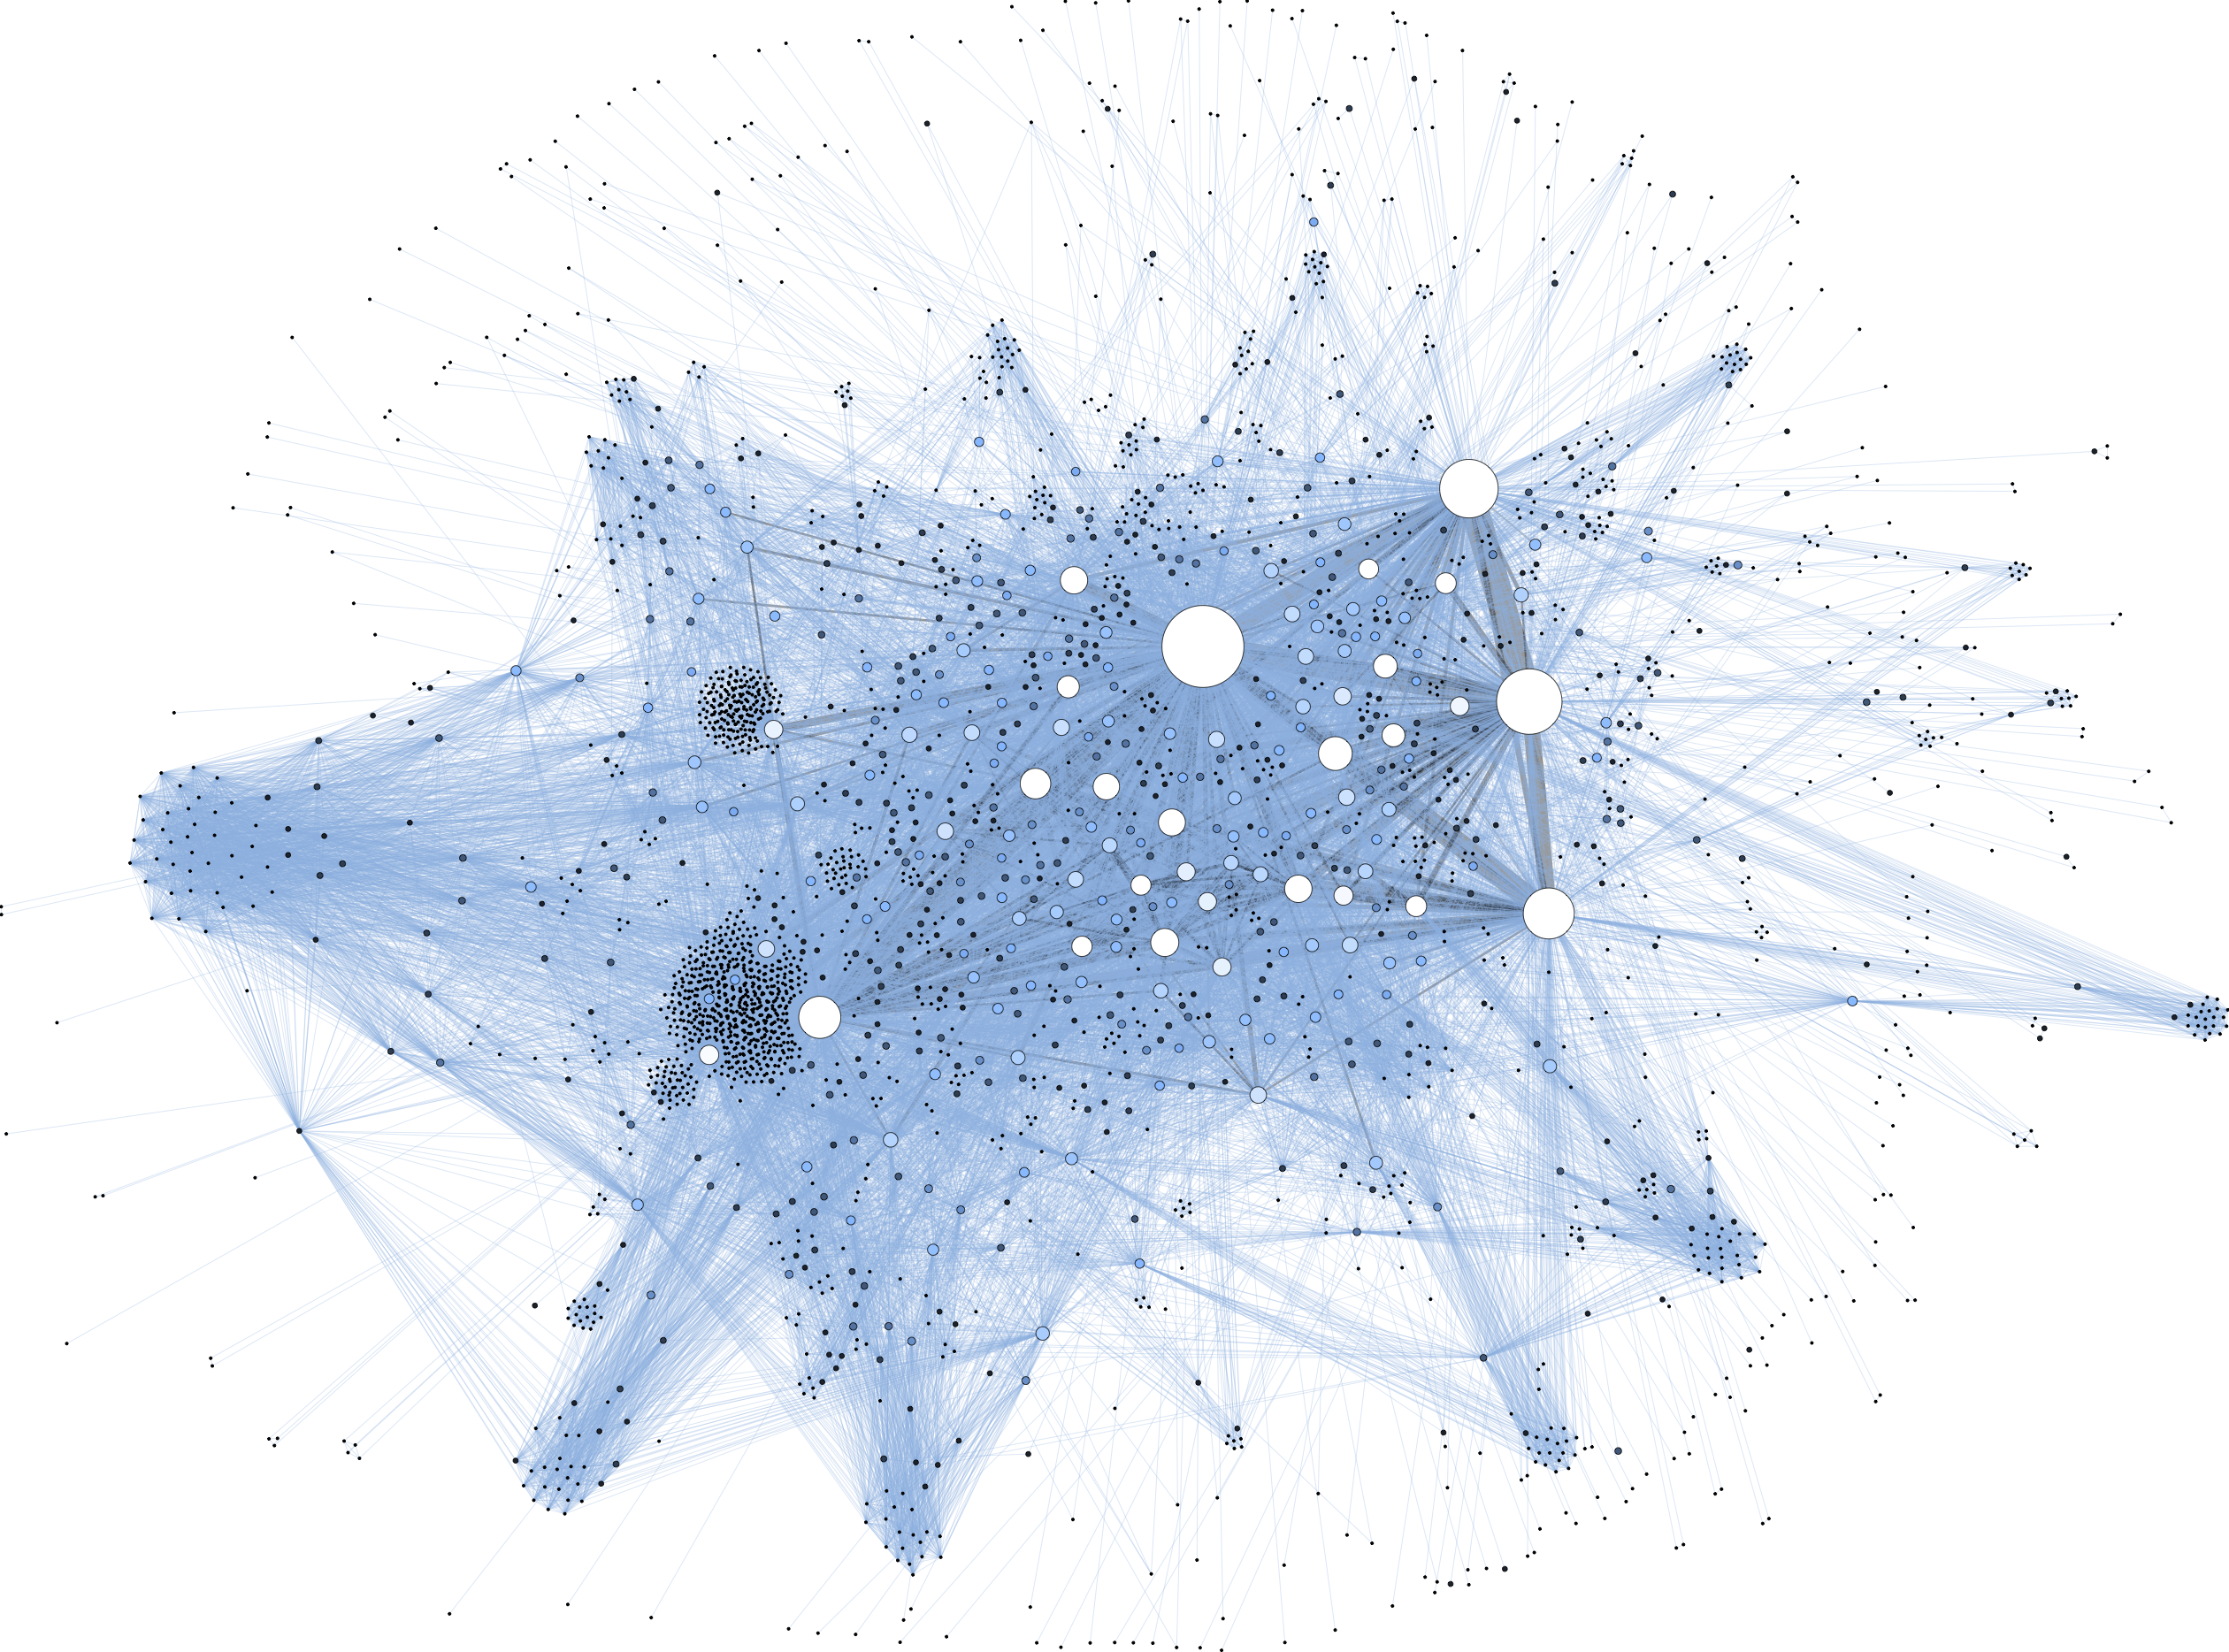
This paper presents the final result of years of manual indexing (intermediary results have already been presented as case-studies in Grandjean, 2015 and Grandjean, 2014). The complete graph (fig.4) displays 38.600 co-occurrences between 3.200 agents of the complete set of documents from 1919 to 1927. The size and color of the nodes are proportional to the number of appearances of the individuals in the index. The size and color of the edges are proportional to the number of co-occurrences of the two people they bind.
Beyond an apparently low visual intelligibility, due to the amount of information and the dataset complexity, such a graph already makes the measurement of its mathematical properties possible (centrality measures, as detailed by Koschützki et al., 2005 or Newman, 2010). Developed as an interactive online visualization, it provides a global view and a more instinctive navigation in the archive directory.
This type of graph is necessary in order to observe what happens at the margins of the institution (and thus also to understand the geography of the object: what is central and what is peripheral). However, as so often in network analysis, the core is so dense that we can not distinguish the edges and therefore makes a more advanced visual analysis impossible.
Here comes the challenge of readability: how to show that elements are not only connected horizontally to other elements by maintaining a macro-structure that does not always correspond to the natural organization of the agents?
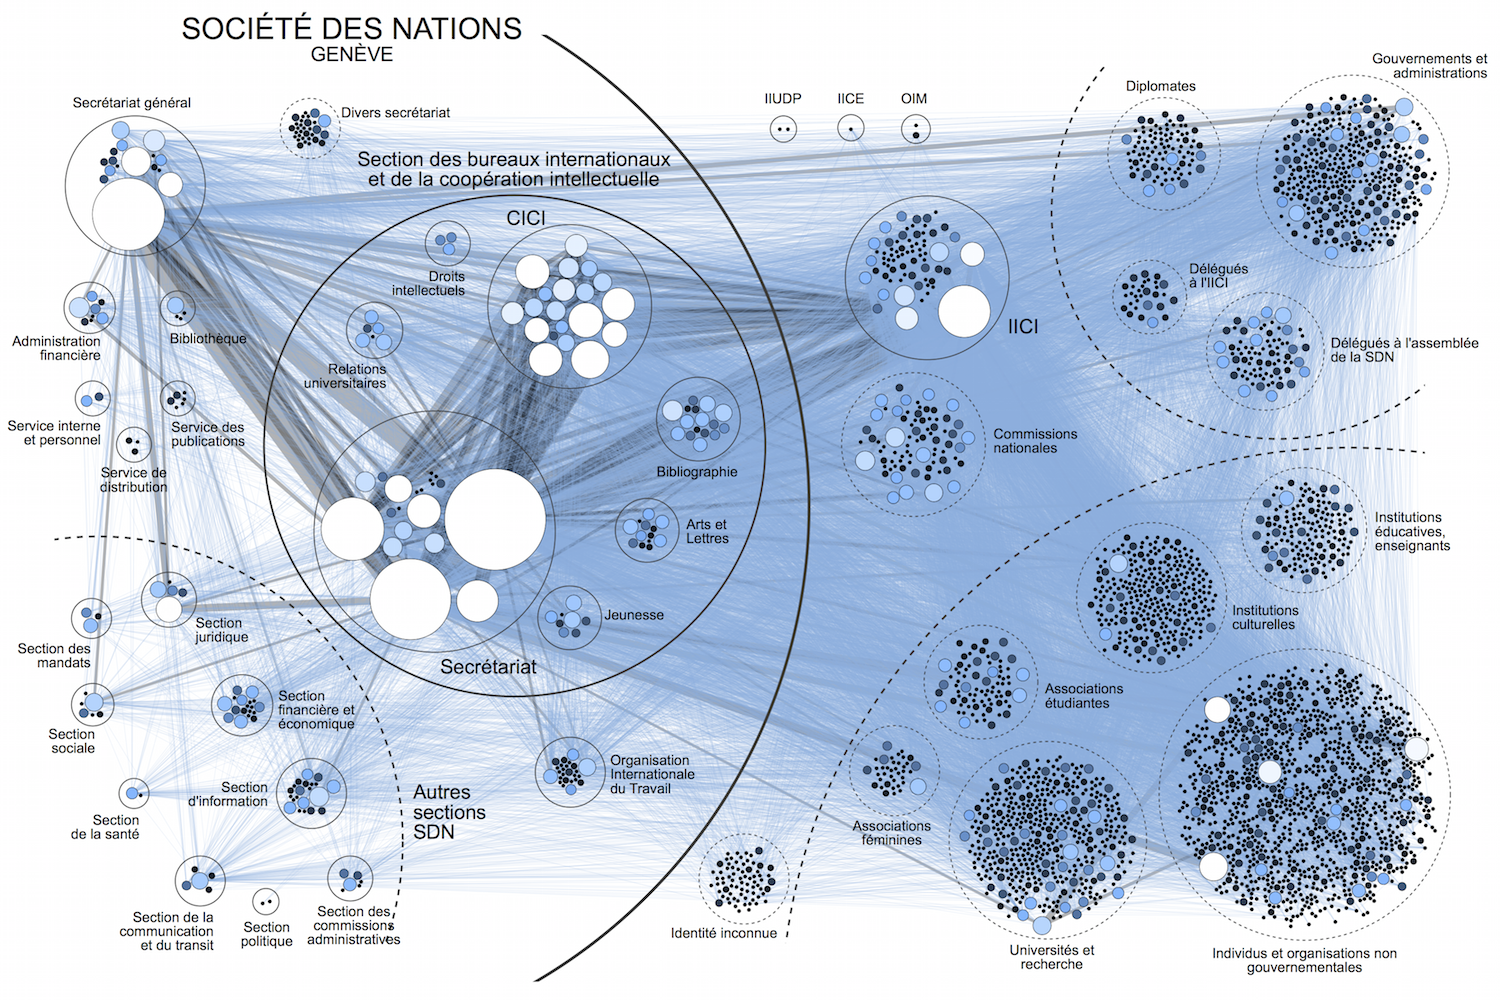
As many opportunities to play with scale exist (Brailly and Lazega, 2012), we chose to flatten the institutional organization on the relational structure (fig.5). Hence our research question: do the scientists, diplomats and senior officials - who constitute the network of intellectual cooperation - structure their relationships in coherence with the organization of their institution? Or, are they the ones that determine the links that their institutions maintain together? Forced distribution of nodes under an administrative “geography” make it easier to read the edges between groups. We also note that this is a way to provide a spatial distribution that does not vary over time, and thus allows the study of several successive moments of the network, without losing the mental map. This system is also suitable for superimposing prosopographical information.
5. Perspectives
It is often at the periphery of the network that the most interesting personal trajectories may be found. As such, this display allows us to discover and highlight the thematic affinities of some of the privileged interlocutors of the ICIC: government delegates, heads of international scientific organizations or partners seeking asylum under the authority of the League of Nations.
The consistency of many internal networks can be evaluated: is the plenary commission a clique (cluster where each and every node is connected to all the others)? Are the expert sub-committees coherent communities? And are these communities created by a well defined group of documents or by a heterogeneous collection of correspondences on various themes?
Pushing further the distant reading, we will also see that the macro-analysis of the institutional level reveals structures that were not clear at the individual level, showing the need for a constant back-and-forth between the scales. This will also be an opportunity to recall that network analysis is a modeling process that does not relieve the researcher of the consultation of the archival documents themselves. From a quantitative approach, we return to the qualitative: the structural organization of a network is definitely a “qualitative, morphological” information (Moretti, 1999; 68) derived from the quantitative compilation of individual relationships.
- Brailly, J. and Lazega E. (2012). Diversité des approches de modélisation statistique en analyse de réseaux sociaux multiniveaux, Mathematics and Social Sciences, 198: 5-28.
- Grandjean, M. (2014). La connaissance est un réseau, perspectives sur l’organisation archivistique et encyclopédique, Les Cahiers du Numérique, 10(3): 37-54.
- Grandjean, M. (2015). Introduction à la visualisation de données : l’analyse de réseau en histoire, Geschichte und Informatik, 18(19): 109-28.
- Koschützki, D., et al. (2005). Centrality Indices. In Brandes U. and Erlebach T. Network Analysis. Springer, pp. 16-61.
- Moretti, F. (1999). Atlas of the European Novel, 1800-1900, Verso Books.
- Moretti, F. (2013). Distant reading, Verso Books.
- Newman, M. E. (2010). Networks: An Introduction, Oxford University Press.
- Pernet, C. (2014). Twists, Turns and Dead Alleys: The League of Nations and Intellectual Cooperation in Times of War, Journal of Modern European History, 12(3): 342-58.