Authors: Manuel Burghardt, Michael Kao, Christian Wolff
Category: Paper:Poster
Keywords: quantitative movie analysis
Beyond Shot Lengths – Using Language Data and Color Information as Additional Parameters for Quantitative Movie Analysis
1. Introduction: Quantitative movie analysis
Film studies make use of both, qualitative as well as quantitative methods (Korte, 2004). While there is a large variety of qualitative approaches to analyze movies (cf. e.g. Monaco, 2009; Sikov, 2010), most quantitative attempts seem to be focused on the analysis of the length and frequency of a film’s shots, which are understood to be the “single definable elements which can be nominated and described” (Salt, 2006: 14). After Barry Salt’s 1 seminal article “Statistical Style Analysis of Motion Pictures” appeared in 1974, numerous other quantitative studies were to follow 2. “Cinemetrics” (Tsivian, 2009) has been suggested as a term to describe these quantitative, shot-based approaches for analyzing movies. Cinemetrics is also the name of a large online database that contains information about shot lengths and frequencies for several thousand films 3.
Studies that take into account quantifiable parameters other than shots are, however, rather rare. Among the few examples are Hoyt et al. (2014), who describe a tool that can be used to visualize relations between the characters of a film. Another example can be found in Ewerth et al. (2009), who present a toolkit that allows researchers to automatically detect shots and camera motion, superimposed text, faces and audio signals. While the latter example is rather focused on the automatic annotation of quantitative features, other projects, such as Lev Manovich’s (2013) „Visualizing Vertov“, focus on the presentation and visualization of quantitative parameters.
In this paper, we suggest to enhance the existing, shot-focused approaches to quantitative movie analysis, by considering additional parameters, such as language (cf. Forchini, 2012) and color use (cf. Flückinger, 2011). We present a prototype that can be used to automatically extract and analyze these parameters from movies and that makes the results accessible in an interactive visualization.
2. A prototype for the analysis of language and color use in movies
Language use as well as the use of colors in movies have long been known in the area of qualitative film studies. We argue, that these parameters are equally suited for a quantitative approach and present an experimental prototype that can be used to quantify the language and color used in different movies. Much like Clement et al. (2008), who discuss the drawbacks and opportunities of computer-based methods in the field of literary studies, we believe that digital, quantitative movie analysis tools can be helpful in “offering provocations, surfacing evidence, suggesting patterns and structures, or adumbrating trends”. As the prototype allows researchers to investigate potential correlations between color usage and corresponding language in a movie, it can be used to examine questions such as the following:
- Are there characteristic patterns in color or language use for movies from different eras, genres, or directors (e.g. dark colors and words such as “kill” or “blood” in horror movies)?
- Are there characteristic color patterns within a film that correlate with the occurrence of certain characters or objects (e.g. bright colors whenever the hero is speaking)?
- Are there characteristic color patterns within a film that correlate with the sentiment of the language (e.g. dark colors for language with negative sentiment)?
2.1. Obtaining language and color data
Machine-readable instances of movie language can be obtained fairly easy in the form of subtitle files, which are freely available via sites such as OpenSubtitles 4; for a precompiled corpus of subtitles also cf. Tiedemann (2012). The standard file structure of such subtitles contains a timestamp as well as a transcription of the actual dialog fragments.
Information about color usage can be extracted directly from the movie itself, by cutting the digital movie into single frames and by calculating the most frequent colors for each frame (color histograms).
2.2. Analyzer component
Our prototype comprises an analyzer and a viewer component. The analyzer can be used to extract single frames from a movie by using the open source tool FFmpeg 5. We used a K-means Cluster algorithm (Wu, 2012) to group together similar RGB values in each frame, as the actual variation of distinct RGB values is too high to allow for any kind of meaningful, quantitative interpretation. The analyzer also processes the subtitle file of a movie and uses Python NLTK 6 to perform basic POS tagging, as we are mainly interested in how nouns correlate with certain colors. We used the Python library TextBlob 7 to perform a simple sentiment analysis for each of the adjectives, tagging them with a polarity score between -1 (negative) and +1 (positive). After the analysis, each frame is saved as a JPG file; all quantitative data is stored in a JSON file.
2.3. Viewer component
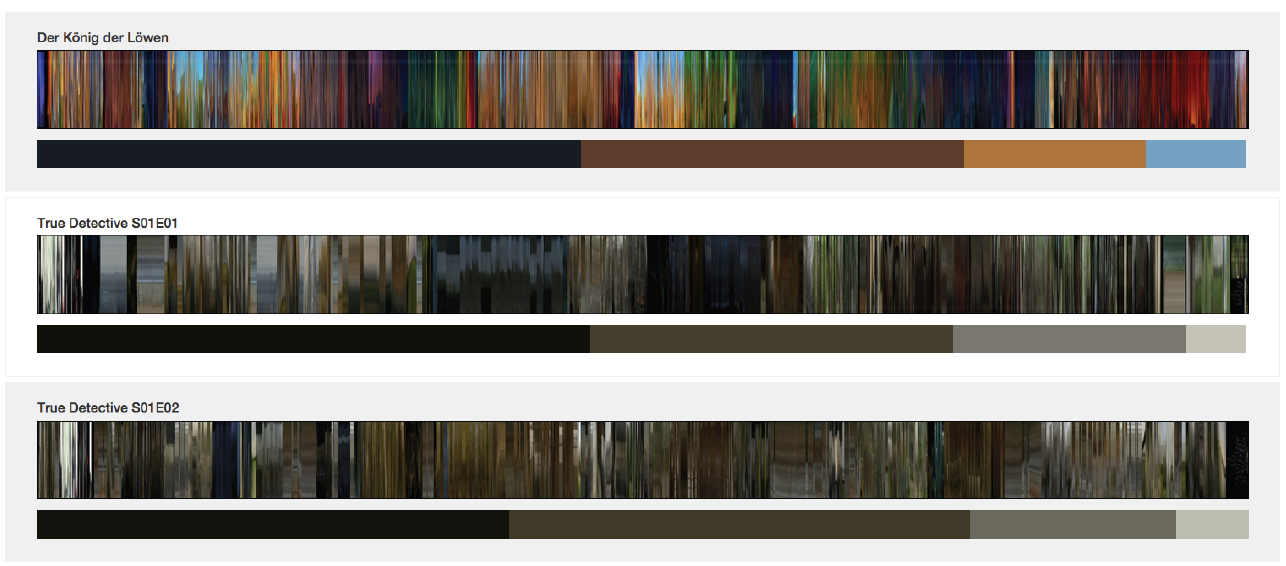
The viewer component uses this data to generate an interactive HTML page that can be viewed in any recent web browser. A popular visualization of the most frequent colors that occur in a movie can be found in the MovieBarcodes 8 project. In a MovieBarcode, each frame of a movie is skewed to be only one pixel wide; all frames are then lined up in a row that looks very much like a colored barcode. On the overview page of our tool, all movies that have been analyzed before are rendered in a MovieBarcode visualization, together with information of the four most frequent colors in the movie (cf. Fig. 1). This view can be used to compare various movies with each other from a more distant perspective.
By clicking on one of the MovieBarcodes, the tool zooms into the respective movie and renders different kinds of information in a more detailed view (cf. Fig. 2).
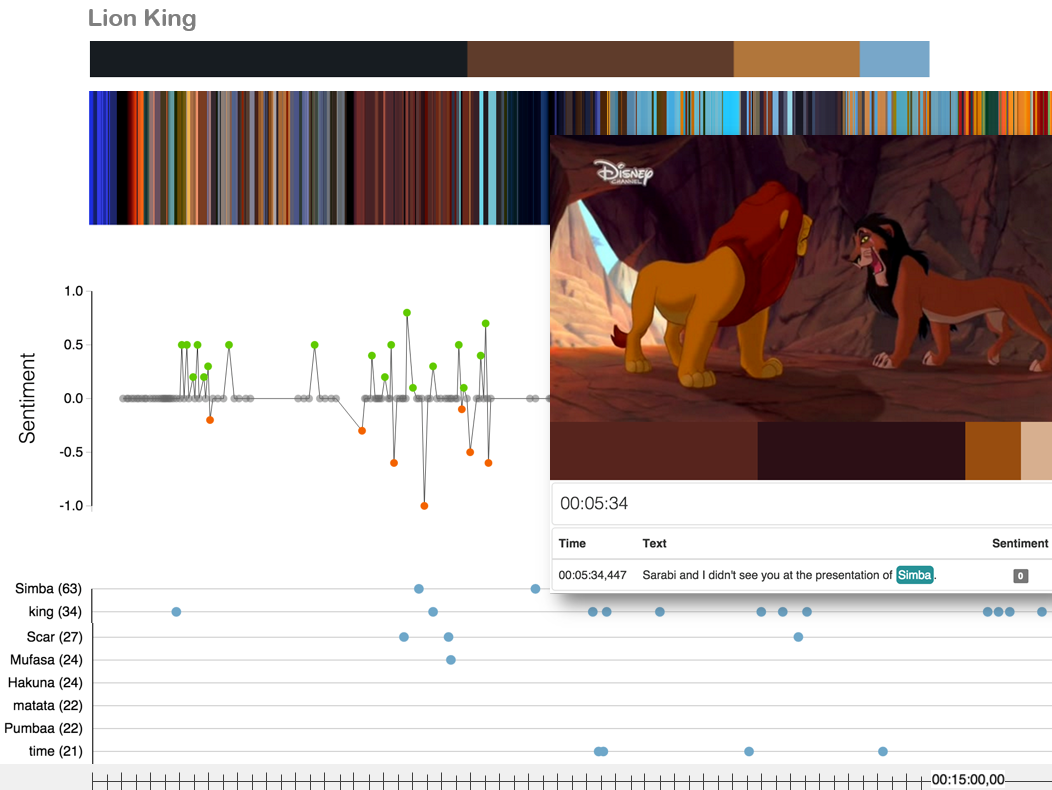
Below the MovieBarcode appears a sentiment graph that aggregates a score between -1 and +1 for each dialog. In the bottom row, the most frequent nouns are displayed. All different types of information are also aligned to the time axis of the movie. The visualization is fully interactive, i.e. by hovering over one of the frames in the MovieBarcode, or a node in the sentiment graph or the noun distribution, the corresponding frame and subtitle appear as an overlay. The complete movie can also be navigated back and forth by means of the arrow keys.
3. Conclusion and future directions
We believe the real strength of a quantitative approach that makes use of language and color information lies in a mix of “distant watching” (cf. Howanitz, 2015) and close watching, i.e. characteristic language-color patterns identified in specific movies can be used as a query to search other movies for similar patterns. Our next steps will therefore go into the direction of an information system that allows researchers to search and compare a collection of movies according to language and color characteristics.
- Buckland, W. (2008). What Does the Statistical Style Analysis of Film Involve? A Review of Moving into Pictures. More on Film History, Style, and Analysis. Literary and Linguistic Computing, 23(2): 219-30.
- Flückiger, B. (2011). Die Vermessung ästhetischer Erscheinungen. Zeitschrift für Medienwissenschaft, 5(2): 44–60.
- Forchini, P. (2012). Movie language revisited. Evidence from multi-dimensional analysis and corpora. Bern et al.: Peter Lang Verlag.
- Clement, T., Steger, S., Unsworth, J. and Uszkalo, K. (2008). How not to read a million books. http://people.brandeis.edu/~unsworth/hownot2read.html (accessed 3 March 2016).
- Hoyt, E. , Ponot , K . and Roy, C. (2014). Visualizing and Analyzing the Hollywood Screenplay with ScripThreads. Digital Humanities Quarterly, 8(4). http://www.digitalhumanities.org/dhq/vol/8/4/000190/000190.html(accessed 3 March 2016).
- Howanitz, G. (2015). Distant Waching: Ein quantitativer Zugang zu YouTube-Videos. Digital Humanities im deutschsprachigen Raum (Dhd) 2015: Conference Abstracts. Graz, pp. 33-39. http://gams.uni-graz.at/o:dhd2015.abstracts-gesamt(accessed 3 March 2016).
- Korte, H. (2004). Einführung in die Systematische Filmanalyse. Berlin: Erich Schmidt Verlag.
- Manovich, L. (2013). Visualizing Vertov. Softwarestudies.com. http://softwarestudies.com/cultural_analytics/Manovich.Visualizing_Vertov.2013.pdf(accessed 3 March 2016).
- Monaco, J. (2009). How to Read a Film: Movies, Media, and Beyond. Oxford (NY): Oxford University Press.
- Salt, B. (2006). Moving into Pictures. More on Film History , Style, and Analysis. London: Starword Publishing.
- Salt, B. (1974). Statistical Style Analysis of Motion Pictures. Film Quarterly, 28(1): 13-22.
- Sikov, E. (2010). Film Studies. An Introduction. New York: Columbia University Press.
- Tiedemann, J. (2012). Parallel Data, Tools and Interfaces in OPUS. Proceedings of the 8th International Conference on Language Resources and Evaluation (LREC) 2012. Istanbul, pp. 2214-18.
- Tsivian, Y. (2009). Cinemetrics, Part of the Humanities’ Cyberinfrastructure. In Ross, M., Grauer, M. and Freisleben, B. (eds.), Digital Tools in Media Studies – Analysis and Research. An Overview. Bielefeld: tanscript Verlag, pp. 93-100.
- Ewerth, R., Mühling, M., Stadelmann, T., Gllavata, J., Grauer, M. and Freisleben, B. (2009). Videana: A Software Toolkit for Scientific Film Studies. In Ross, M., Grauer, M. and Freisleben, B. (eds.), Digital Tools in Media Studies – Analysis and Research. An Overview. Bielefeld: tanscript Verlag, pp. 100-16.
- Wu, J. (2012). Advances in K ‑ means Clustering: A Data Mining Thinking. Berlin and Heidelberg: Springer-Verlag.
For a concise review of Barry Salt’s work on quantitative movie analysis cf. Buckland (2008).
For a comprehensive overview of Cinemetrics-related research cf. the bibliography compiled by Mike Baxter, available online at http://www.cinemetrics.lv/dev/bibliography_with_essay_Baxter.pdf (accessed 3 March 2016).
http://www.cinemetrics.lv (accessed 3 March 2016).
www.opensubtitles.org (accessed 3 March 2016).
https://www.ffmpeg.org/ (accessed 3 March 2016).
http://www.nltk.org/ (accessed 3 March 2016).
http://textblob.readthedocs.org/ (accessed 3 March 2016).
http://moviebarcode.tumblr.com (accessed 3 March 2016).