Authors: Gulcan Can, Jean-Marc Odobez, Carlos Pallan Gayol, Daniel Gatica-Perez
Category: Paper:Long Paper
Keywords: Maya glyphs, t-SNE
Ancient Maya Writings as High-Dimensional Data: a Visualization Approach
1. Introduction
The ancient Maya civilization flourished from around 2000 BC to 1600 AD and left a great amount of cultural heritage materials, in the shape of stone monument inscriptions, folded codex pages, or personal ceramic items. All these materials contain hieroglyphs (in short glyphs) written on them. The Maya writing system is visually complex (Fig. 1) and new glyphs are still being discovered. This brings the necessity of better digital preservation systems. Interpretation of a small amount of glyphs is still open to discussion due to both visual differences and semantic analysis. Some glyphs are damaged, or have many variations due to artistic reasons and the evolving nature of language.
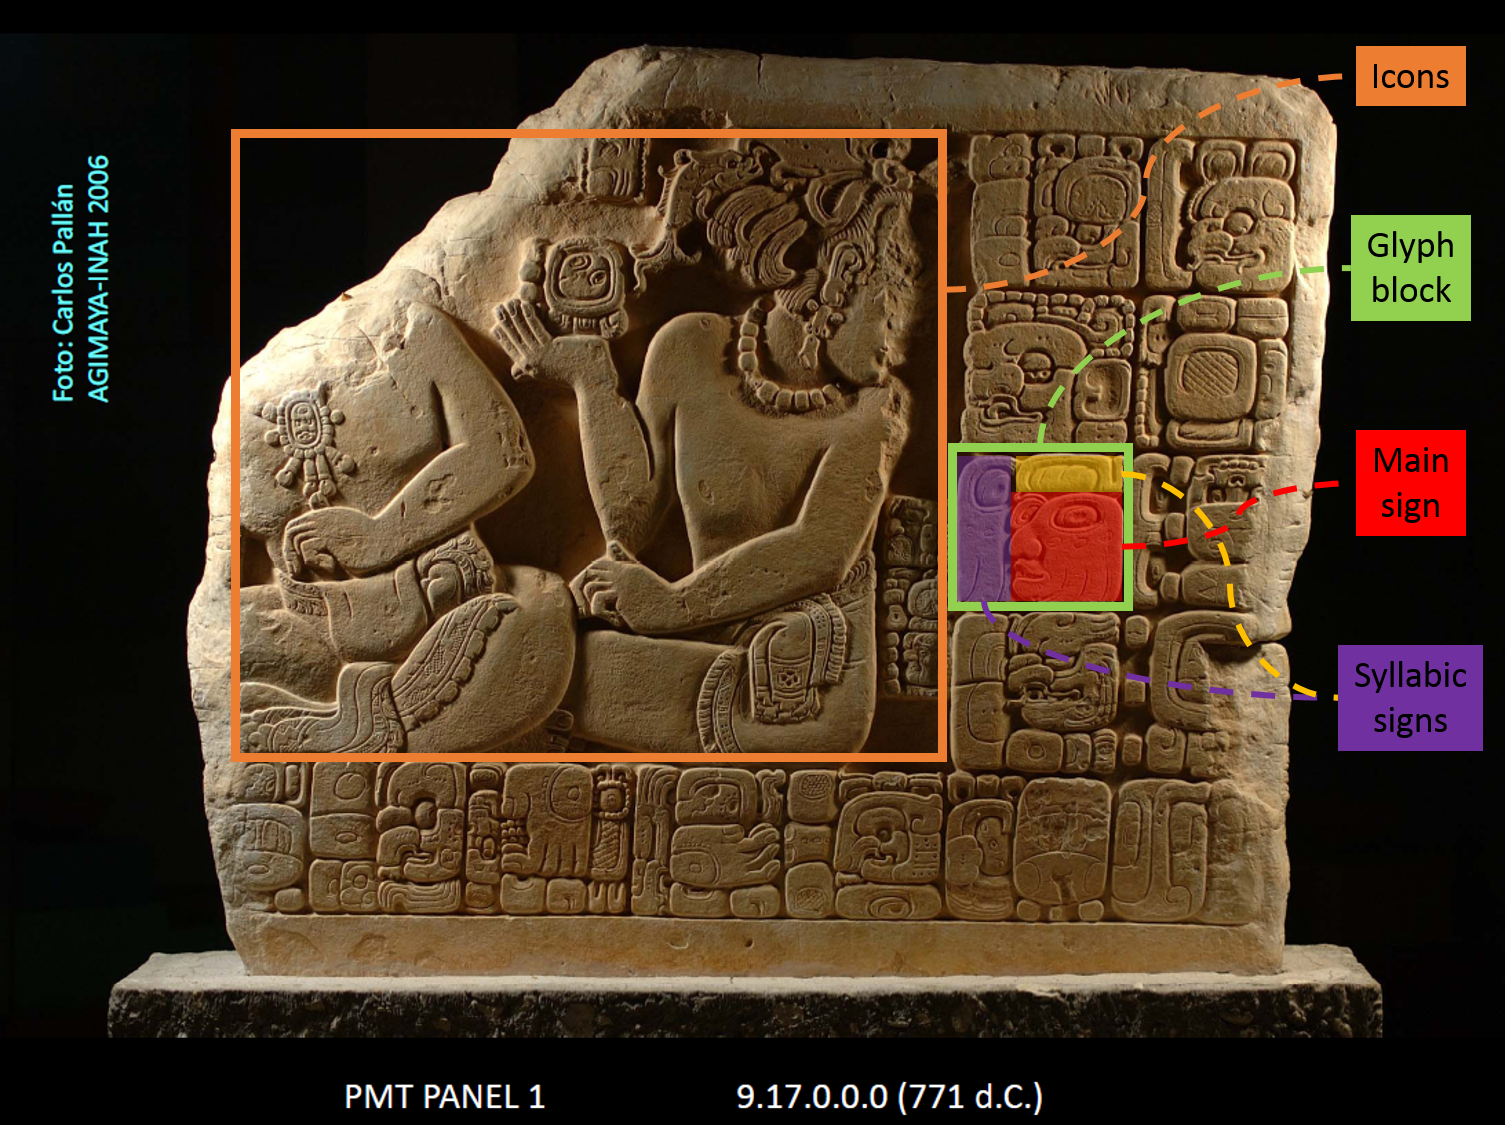
Signs following ancient Mesoamerican representational conventions end up being classified according to their appearance, which leads to potential confusions as the iconic origin of many signs and their transformations through time are not well-understood. For instance, a sign thought to fall within the category of 'body-part' can later be proven to actually correspond to a vegetable element (a different semantic domain). Similarly, several signs classified as 'abstract', 'square' or 'round' could actually be pars-pro-toto representations of a larger whole.
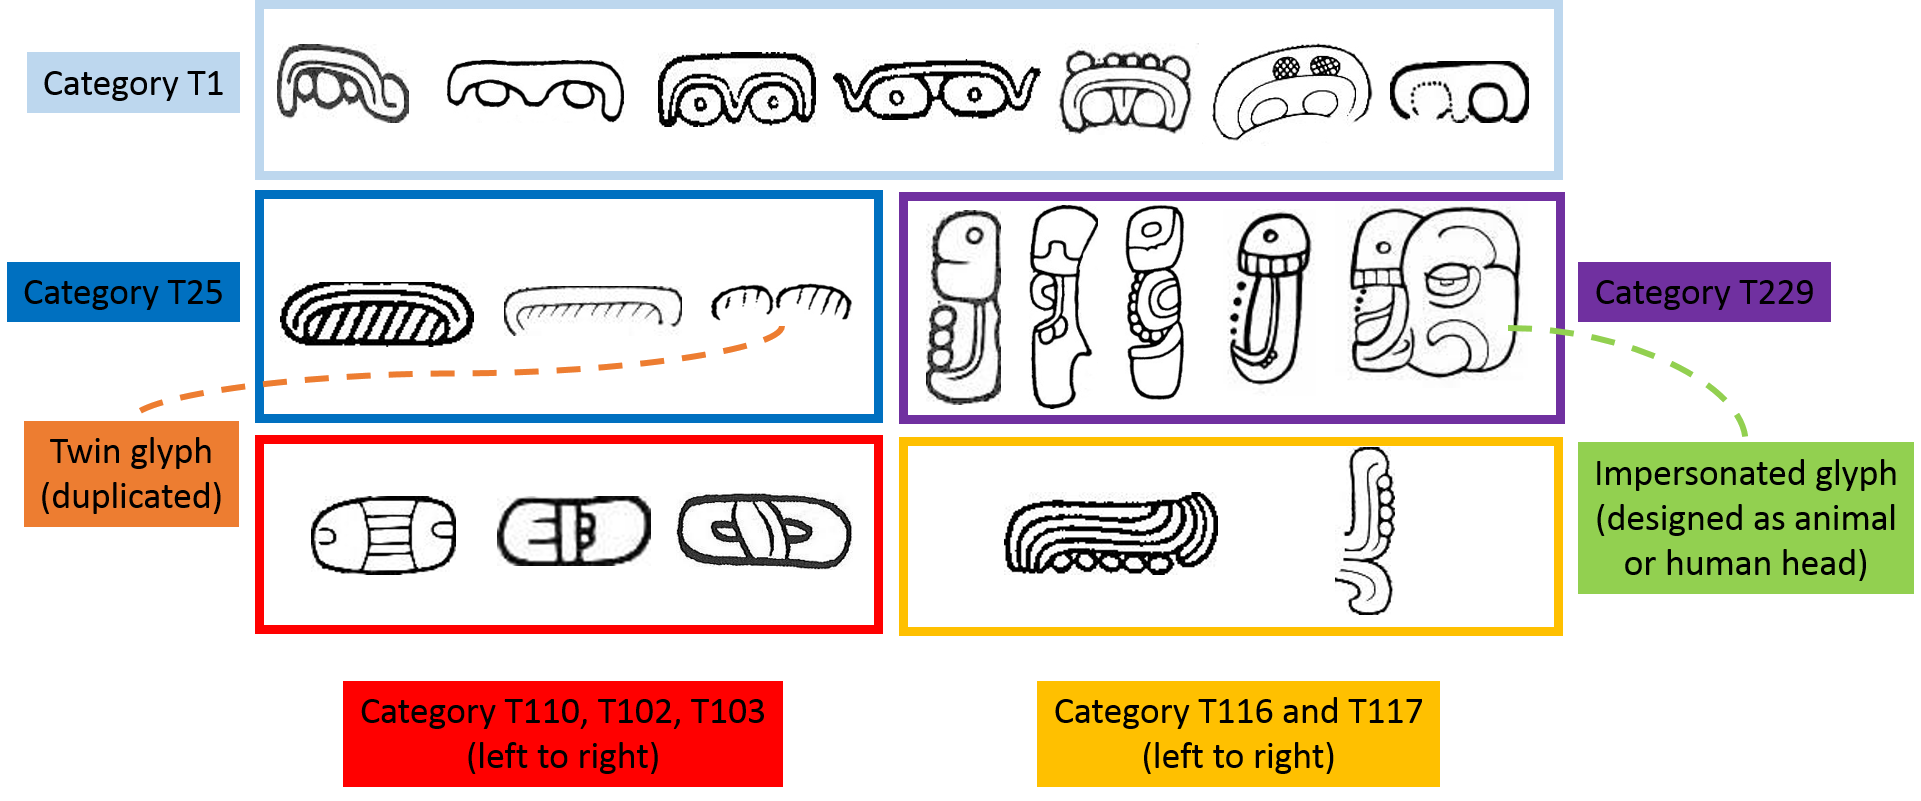
Fig. 2 illustrates the challenges to analyse Maya glyphs visually. Adding functionalities that take context (i.e., co-occurrence statistics, characteristics of the data) and part-whole relations (i.e., highlighting diagnostic parts) into account would bring guidance during decipherment tasks. The tools we envision are different from existing almanac-by-almanac visualization systems (Vail and Hernandez, 2013). They are also more engaging for users (i.e. visitors in museums), and offer promising perspectives for scholars.
This motivates the study of data visualization. In this paper, we built a prototype for visualization of glyphs based on visual features. We introduce (1) an approach to analyse Maya glyphs combining a state-of-the-art visual shape descriptor, and (2) a non-linear method to visualize high-dimensional data. For the first component, we use the histogram of orientation shape context (HOOSC) (Roman-Rangel et. al., 2011a; Roman-Rangel et. al., 2011b; Roman-Rangel et. al., 2013) which has similarities to other descriptors of the recognition literature (Belongie et. al., 2002; Dalal and Triggs, 2005; Lowe, 2004), but is adapted to shape analysis (Franken and van Gemert, 2013).
For the second component, we use the t-distributed Stochastic Neighbourhood Embedding (t-SNE) (Van der Maaten and Hinton, 2008), which is a dimensionality reduction method from the machine learning literature that has value for Digital Humanities (DH), as it can highlight the structure of high-dimensional data, i.e., multiple viewpoints among samples.
As analysis of DH data is often based on attributes like authorship, produced time, and place, observing these variations as smooth transitions with t-SNE becomes a relevant feature.
We show that the proposed methodology is useful to analyse the extent of spatial support used in the shape descriptor and to reveal new connections in the corpus through inspection of glyphs from stone monuments and glyph variants from catalogue sources. In particular, we hope that the presentation of our use of t-SNE can motivate further work in DH for other related problems.
2. Methodology

The analysis process is illustrated in Fig. 3. First, for each glyph, a standard visual bag-of-words representation (BoW) is computed from the HOOSC descriptors. Second, dimensionality reduction is performed on the BoW representation of a glyph collection to generate the visualization. The main steps are described below.
2.1. Datasets
We analyse our visualization pipeline on two individual Maya glyph datasets.
2.1.1. Monument data
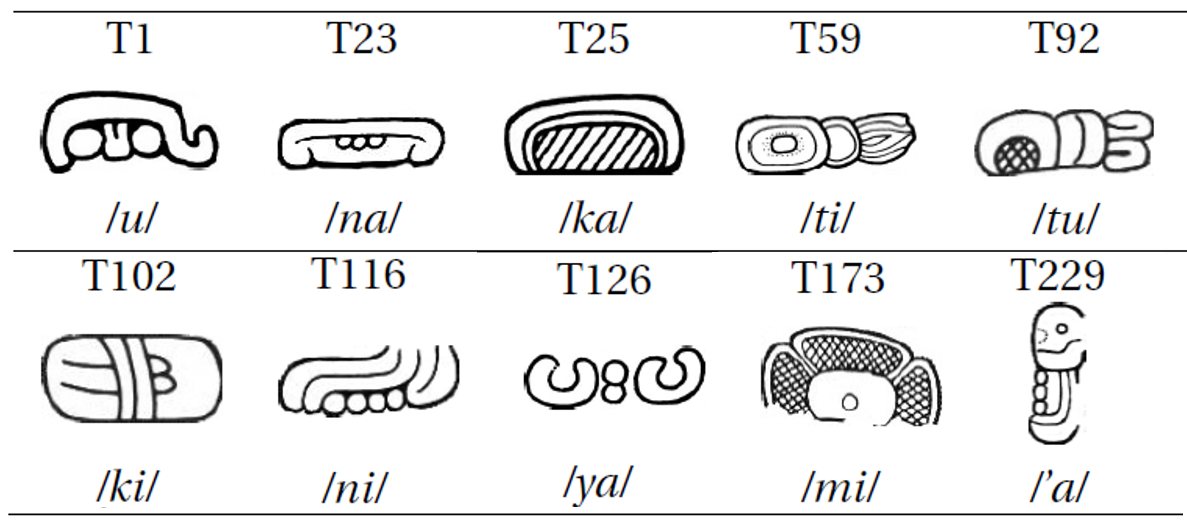
We use a subset (630 samples from 10 classes, Fig. 4) of hand-drawings (Roman-Rangel et. al., 2011), corresponding to syllabic glyphs inscribed in monuments. These samples are collected by archaeologists (as part of Mexico’s AJIMAYA project) from stone inscriptions spread over four regions (Peten, Usumacinta, Motagua, and Yucatan). As an additional source, around 300 glyph samples are taken from existing catalogues (Thompson and Eric, 1962; Macri and Looper, 2003).
2.1.2. Thompson catalogue
Secondly, we use 1487 glyph variants cropped from the Thompson's catalogue. These variants belong to 814 categories and divided as main sign and prefix/suffix groups in the catalogue.
2.2. Visual feature representation
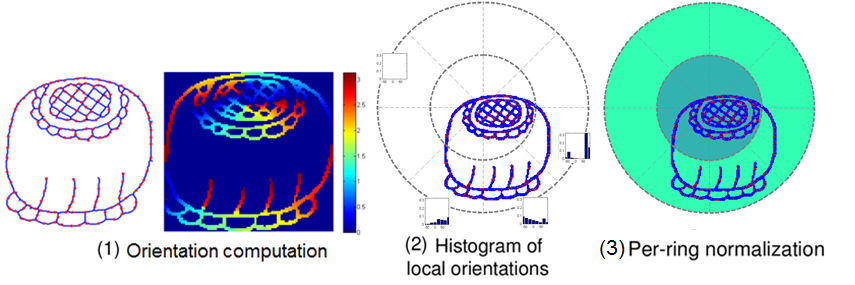
The HOOSC is a shape descriptor proposed in our research group for Maya glyphs (Roman-Rangel, 2011b). It is computed in two main steps (Fig. 5). First, the orientations of a set of sampled points are computed. Secondly, for a given sampled position, the histogram of local orientations are computed using a small number Na of angle bins forming a circular grid partition centred at each point. The HOOSC descriptor is obtained by concatenating all histograms, and applying per-ring normalization. Basic parameters are the spatial context sc defining the extent of the spatial partition; the number of rings N r; and the number N s of slices in a ring. With N a =8, N r =2, N s=8, HOOSC has 128 dimensions. We have used HOOSC for usual retrieval and categorization tasks (Hu et. al., 2015).
2.3. Dimensionality reduction: t-SNE
Proposed in (Hinton and Roweis, 2002), SNE is a non-linear dimensionality reduction method. It relates the Euclidean distances of samples in high-dimensional space to the conditional probability for each point selecting one of the neighbours. In t-SNE (Van der Maaten and Hinton, 2008), these distributions are modelled as heavy-tailed t-distributions. t-SNE aims to find for each data point, a lower-dimensional projection such that the conditional probabilities in the projected space are as close as possible to those of the original space (measured with KL divergence (Kullback and Leibler, 1951)).
In our application, first, we project the BoW representation to a 30-dimensional space using PCA, then applied t-SNE to these projections to get 2-dimension mapping. t-SNE keeps track of the local structure of the data as it optimizes the clusters globally.
3. Results and discussion
The full-scale visualization of the glyphs are available at https://www.idiap.ch/project/maaya/demos/t-sne.
3.1. Glyph monument corpus structure
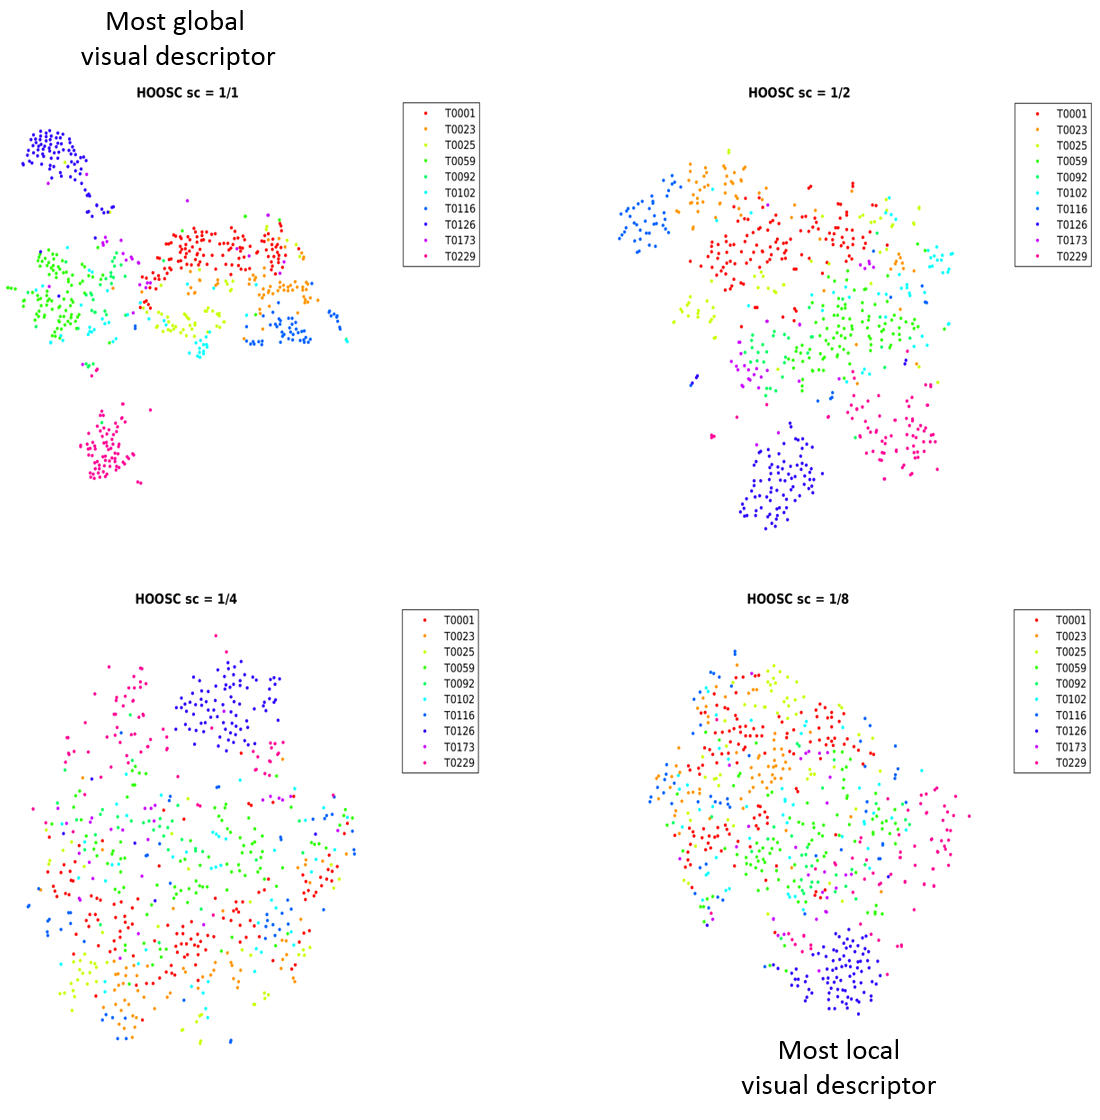
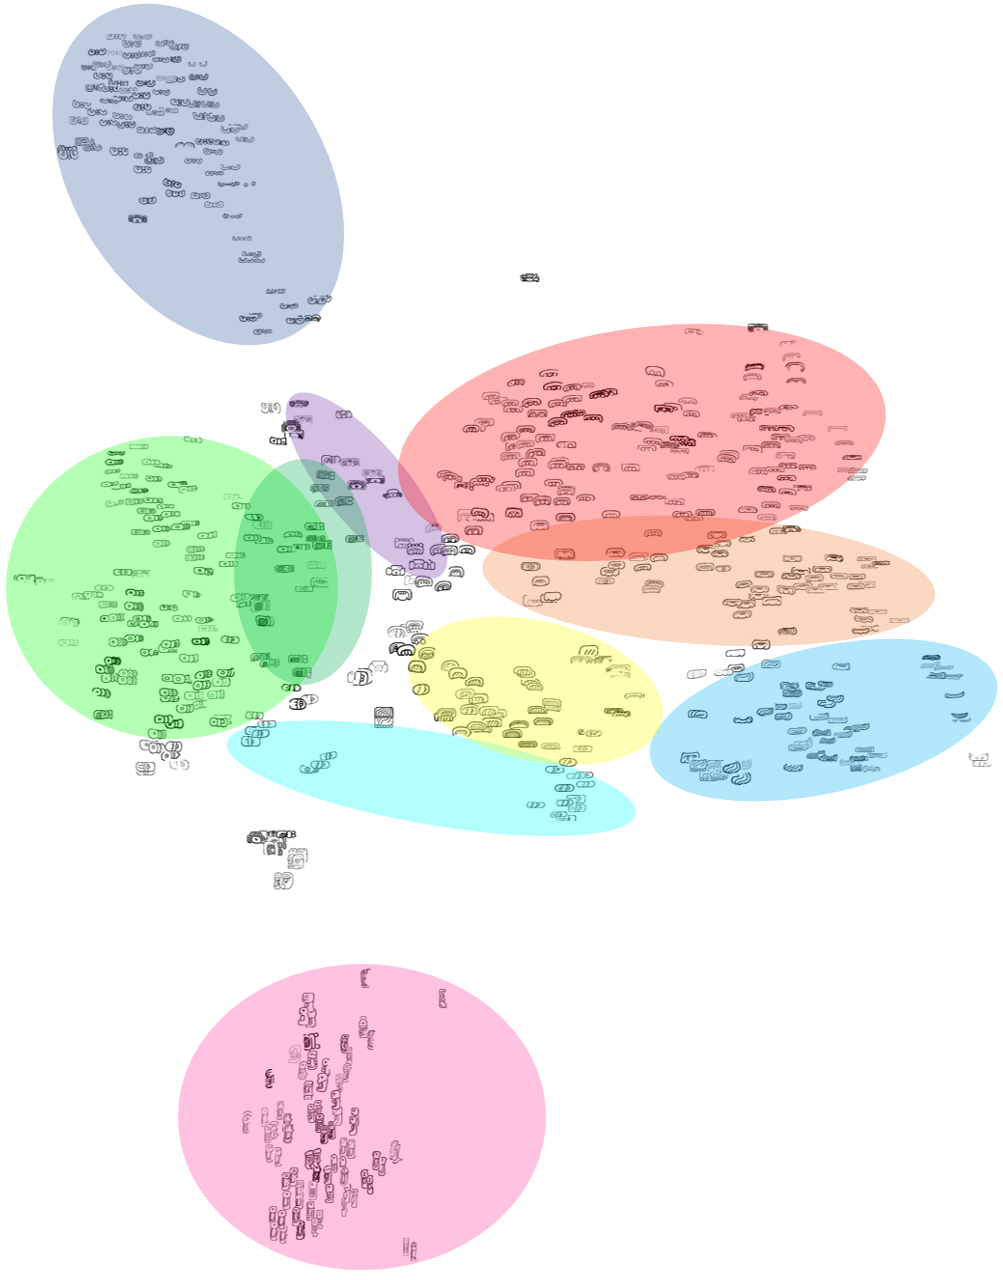
Fig. 6 shows the monument corpus. The region encoded in the visual descriptor varies from almost whole glyph (sc=1/1) to small local parts (sc=1/8). One question is how spatial context influences visualization of the representation. Regarding the visual clusters, with the most global representation (sc=1/1), our method extracts more distinct clusters, e.g. T229 and T126 in Fig. 7 (navy and magenta in Fig. 6 and 9). Please see Fig. 9 for roughly-coloured clusters of the glyphs. As the descriptor gets more local, the categories with common patterns mix up (Fig. 6). Yet, our method is able to capture meaningful common local parts and maps the samples based on these elements, i.e. parallel lines, hatches, and circles.
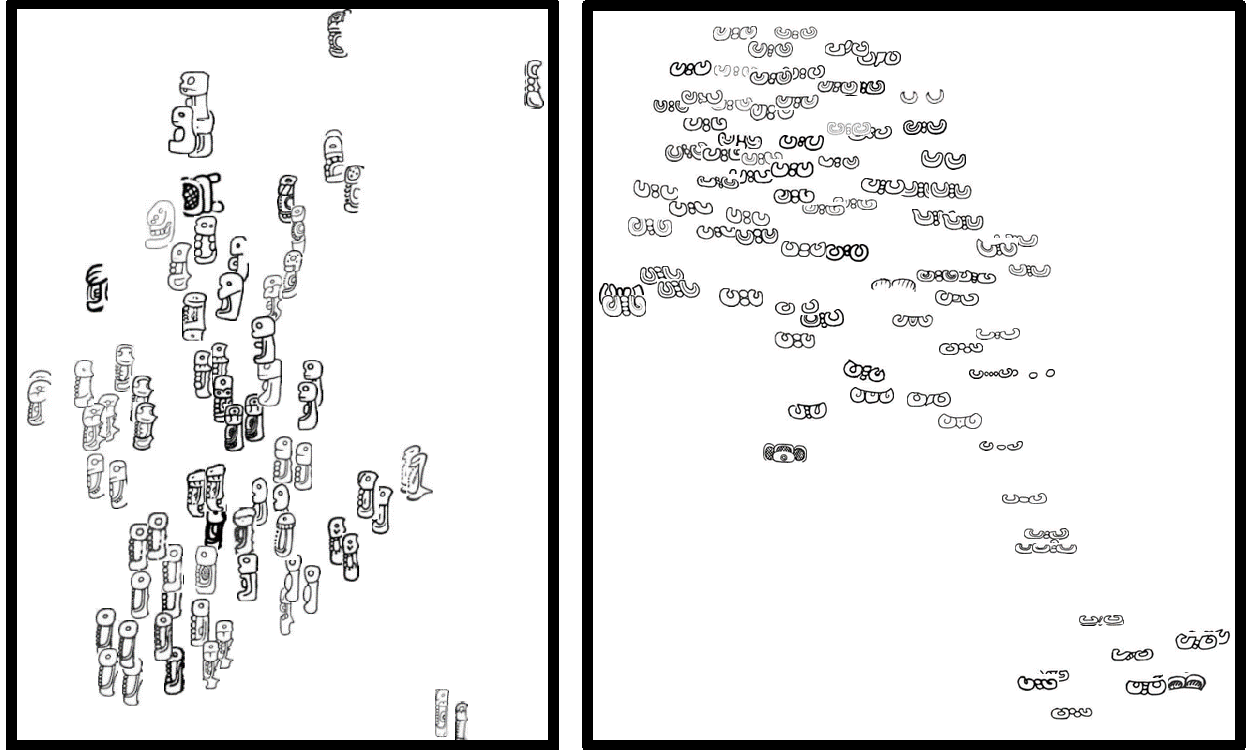
For Maya epigraphers in our team, a more neatly differentiated grouping of signs, e.g. obtained by HOOSC with sc=1/1 is preferable. However, work on the effects of parameter choice is required to obtain groupings that make more epigraphic sense. Clearer 'borderlines', less 'outliers,' and less 'intrusive' signs (e.g. T25 and T1) within each cluster would be desirable. Our results in this regard are preliminary, but they open promising research questions.
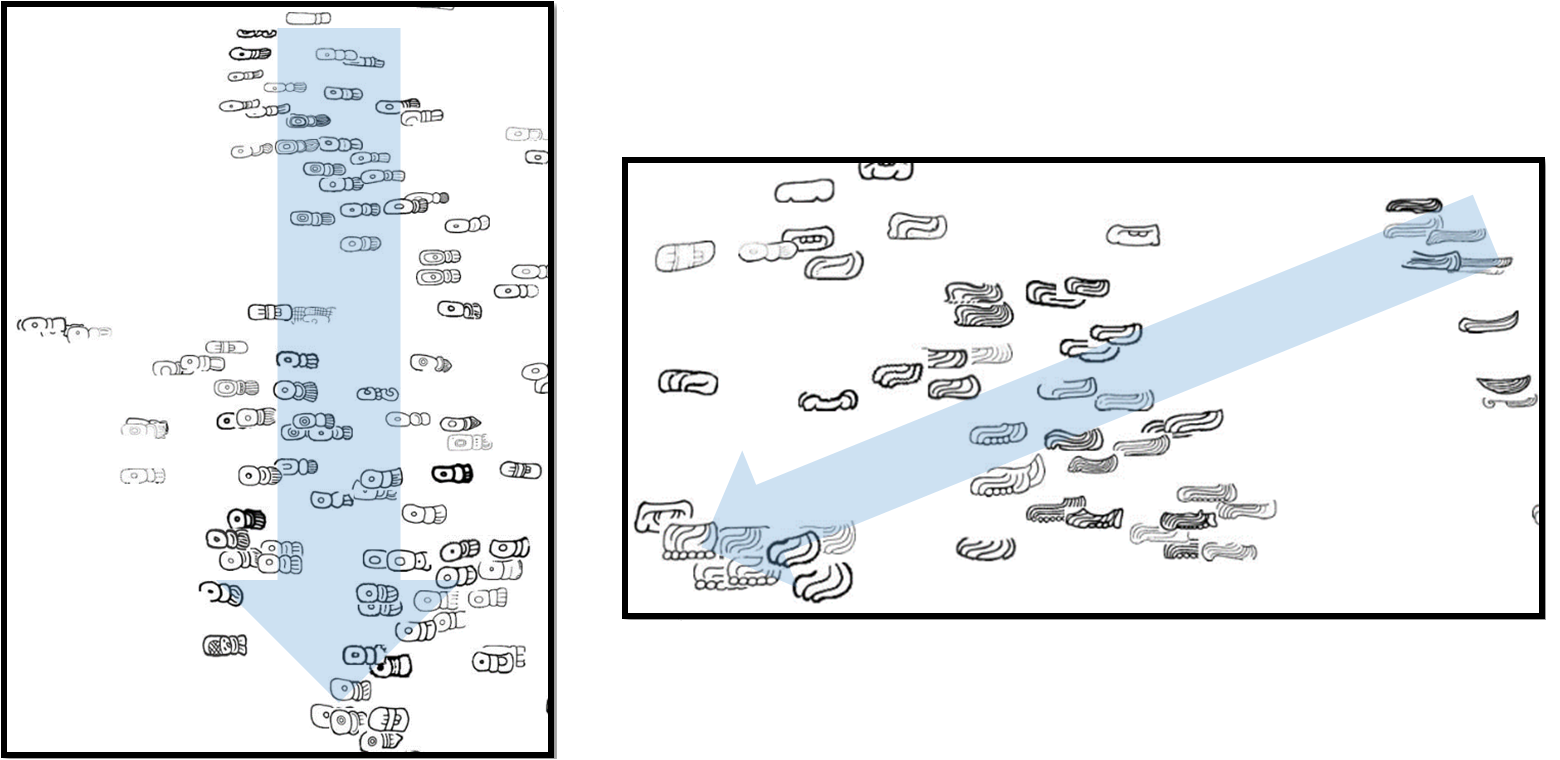
Another important epigraphic point is that we observe interesting visual transitions between samples of the categories. Fig. 8 shows examples from category T59 and T116, which illustrate a smooth dilation of samples in one direction. These kind of observations are interesting for archaeologists, since they might correspond to modification of the glyph signs over time or place.
3.2. Glyph variants from Thompson catalogue
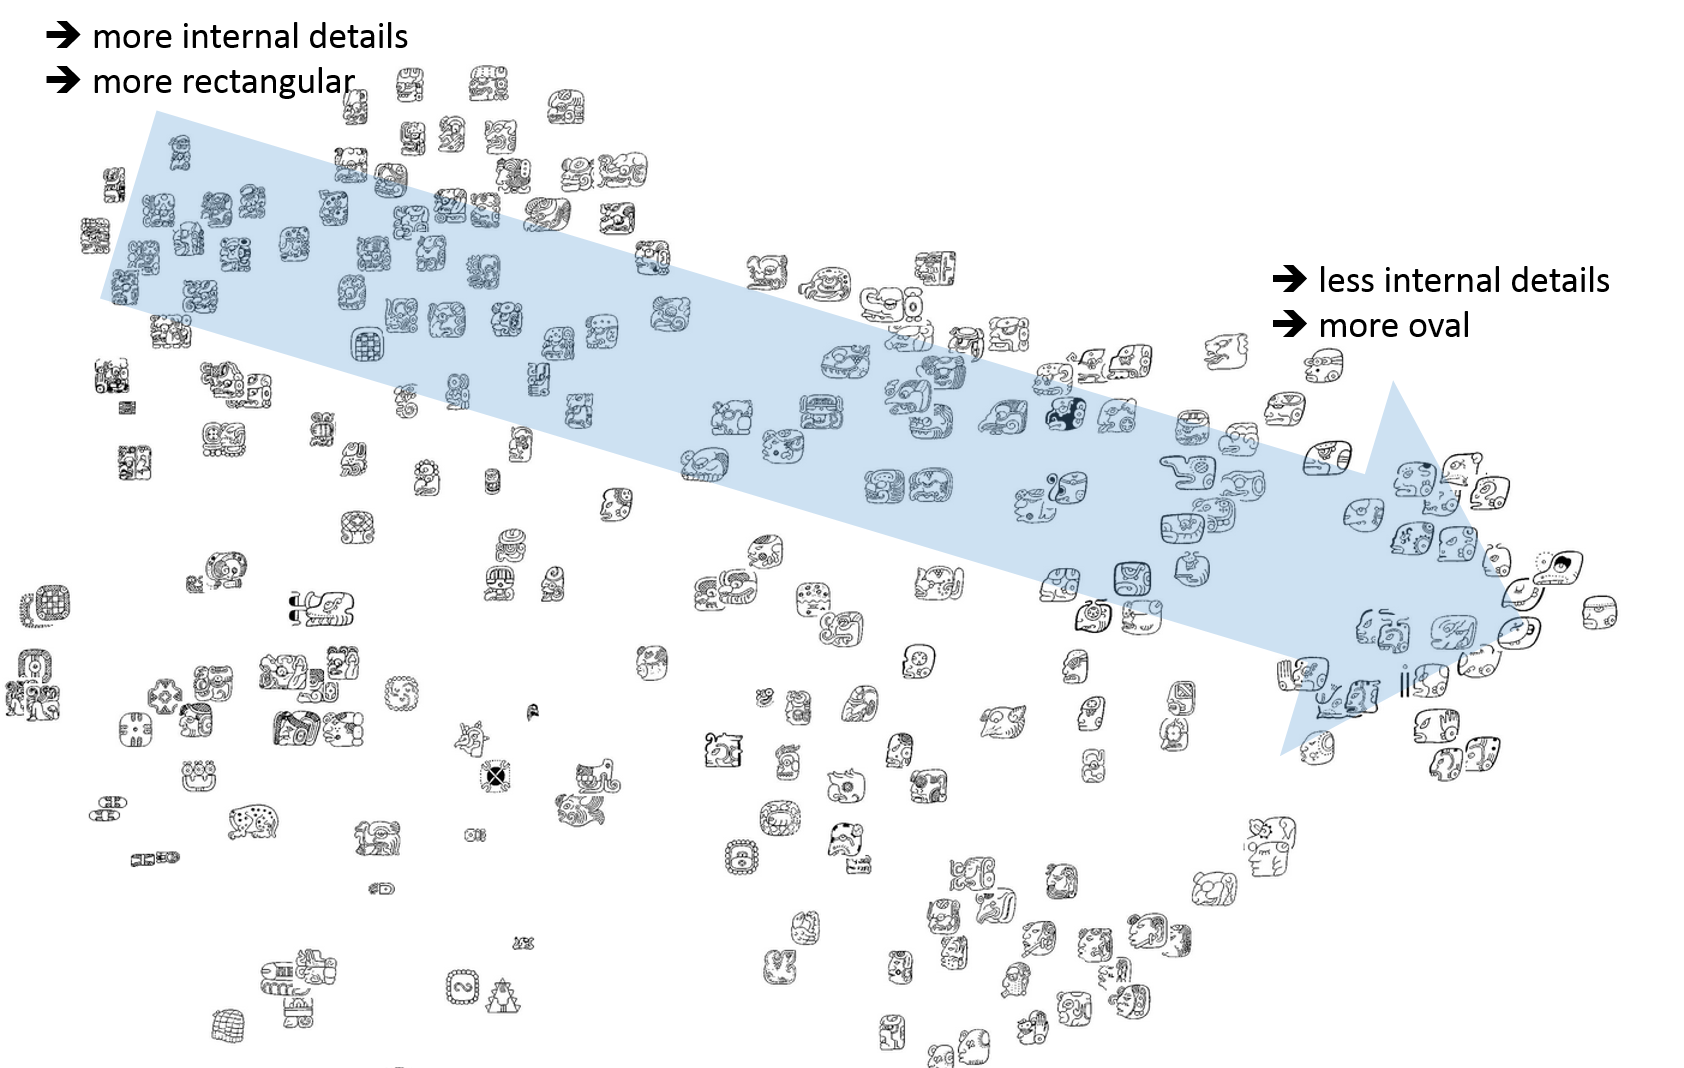
From the visualization of glyph variants in Thompson's catalogue with the largest spatial context level (sc=1/1), we observe that visually similar categories are grouped together, while exhibiting smooth transitions. These transitions may correspond to some characteristics of the data. Fig. 10 shows a cluster of personified main signs in which degree of visual internal detail decreases in the indicated direction. We also observe separate visual clusters for hatched, horizontal and vertical glyphs.
4. Conclusion
Our goal in this study is to help DH scholars to visualize data collections not as isolated elements, but in context (visually and semantically). Even though early catalogues are built based on visual similarities, i.e., (Thompson and Eric, 1962) or (Zimmermann, 1956) relied on graphic cards to study similar patterns, the categorization methods were poorly understood and were not easy to reconfigure.
Furthermore, due to the limited knowledge at the time about semantics and sign variants, these catalogues turned out to be inaccurate or outdated. Similarly, Gardiner’s list (Gardiner, 1957) is insufficient to elucidate sign variability in the 'Book of The Dead' (Budge, 1901).
With the proposed tool, however, considering details at different scales as semantic/diagnostic regions in the visualization can help archaeologists to discover semantic relations. In this way, overlapping notions such as 'colours', 'cardinal directions' and specific toponyms from earthly, heavenly or underworld realms can be studied in greater detail.
Finally, illustrating all variations with different visual focus in a fast and quantitative manner brings out the characteristics of signs. This also helps experts match samples from various sources (i.e. monuments, codices, and ceramic surfaces) to corpus data more efficiently; and trigger the decipherment of less frequent and damaged signs. Hence, our work is a step towards producing a more accurate and state-of-the-art sign catalogue.
5. Acknowledgements
This work was funded by Swiss National Science Foundation as part of the MAAYA project.
- Belongie, S., Malik, J. and Puzicha, J. (2002). Shape matching and object recognition using shape contexts. IEEE Transactions on Pattern Analysis and Machine Intelligence, 24(4): 509–22.
- Budge, E. A. W. (1901). The Book of the Dead: An English Translation of the Chapters, Hymns, Etc. of the Theban Recension, with Introduction, Notes, Etc. (Books on Egypt and Chaldaea). Open Court Pub.
- Dalal, N. and Triggs, B. (2005). Histograms of Oriented Gradients for Human Detection. vol. 1. IEEE, pp. 886–93.
- Franken, M. and Gemert, J. C. van (2013). Automatic Egyptian hieroglyph recognition by retrieving images as texts, ACM Press, pp. 765–68.
- Gardiner, A. H. (1957). Egyptian Grammar: Being an Introduction to the Study of Hieroglyphs. 3d ed., rev. Oxford: Griffith Institute, Ashmolean Museum.
- Hinton, G. E. and Roweis, S. T. (2002). Stochastic neighbor embedding. pp. 833–40.
- Hu, R., Can, G., Pallan Gayol, C., Krempel, G., Spotak, J., Vail, G., Marchand-Maillet, S., Odobez, J.-M. and Gatica-Perez, D. (2015). Multimedia Analysis and Access of Ancient Maya Epigraphy: Tools to support scholars on Maya hieroglyphics. Signal Processing Magazine, IEEE, 32(4): 75–84.
- Kullback, S. and Leibler, R. A. (1951). On information and sufficiency. The Annals of Mathematical Statistics, 22(1): 79–86.
- Lowe, D. G. (2004). Distinctive image features from scale-invariant keypoints. International Journal of Computer Vision, 60(2): 91–110.
- Maaten, L. Van der and Hinton, G. (2008). Visualizing data using t-SNE. Journal of Machine Learning Research, 9(2579-2605): 85.
- Macri, M. J. and Looper, M. G. (2003). The New Catalog of Maya Hieroglyphs: The Classic Period Inscriptions. University of Oklahoma Press. Vol. 1.
- Roman-Rangel, E., Odobez, J.-M. and Gatica-Perez, D. (2013). Evaluating shape descriptors for detection of maya hieroglyphs. Pattern Recognition. Springer, pp. 145–54.
- Roman-Rangel, E., Pallan, C., Odobez, J.-M. and Gatica-Perez, D. (2011a). Analyzing ancient maya glyph collections with contextual shape descriptors. International Journal of Computer Vision, 94(1): 101–17.
- Roman-Rangel, E., Pallan Gayol, C., Odobez, J.-M. and Gatica-Perez, D. (2011b). Searching the past: an improved shape descriptor to retrieve Maya hieroglyphs. ACM, pp. 163–72.
- Thompson, J. E. S. and Eric, S. (1962). A Catalog of Maya Hieroglyphs. University of Oklahoma Press Norman.
- Vail, G. and Hernández, C. (2013). The Maya Codices Database, Version 4.1. A Website and Database Available at: http://www.mayacodices.org/.
- Zimmermann, G. (1956). Die Hieroglyphen Der Maya-Handschriften. (Abhandlungen Aus Dem Gebiet Der Auslandskunde / Reihe B: Völkerkunde, Kulturgeschichte Und Sprachen). De Gruyter.
