Authors: Jeremi K. Ochab
Category: Paper:Poster
Keywords: authorship attribution, machine learning, time series analysis, long-range memory, feature selection
Time Series Analysis Enhances Authorship Attribution
1. Introduction
Long-range correlations in texts – emerging even in dictionaries and allowing to differentiate genres (Montemurro and Pury, 2002) – prove that structures larger than necessitated by syntax exist. They might reflect organisation of literary works, and be one of authorial fingerprints.
Stylometry, however, have not exploited the information carried by memory longer than one clause apart – other than use of n-grams (e.g., Eder, 2011). Existing studies include investigating: sequences of (un)stressed syllables (Pawłowski, 1998; 1999); sentence lengths (Drożdż et al., 2016); transferring long-range correlations between letter and word sequences (Altmann et al., 2012).
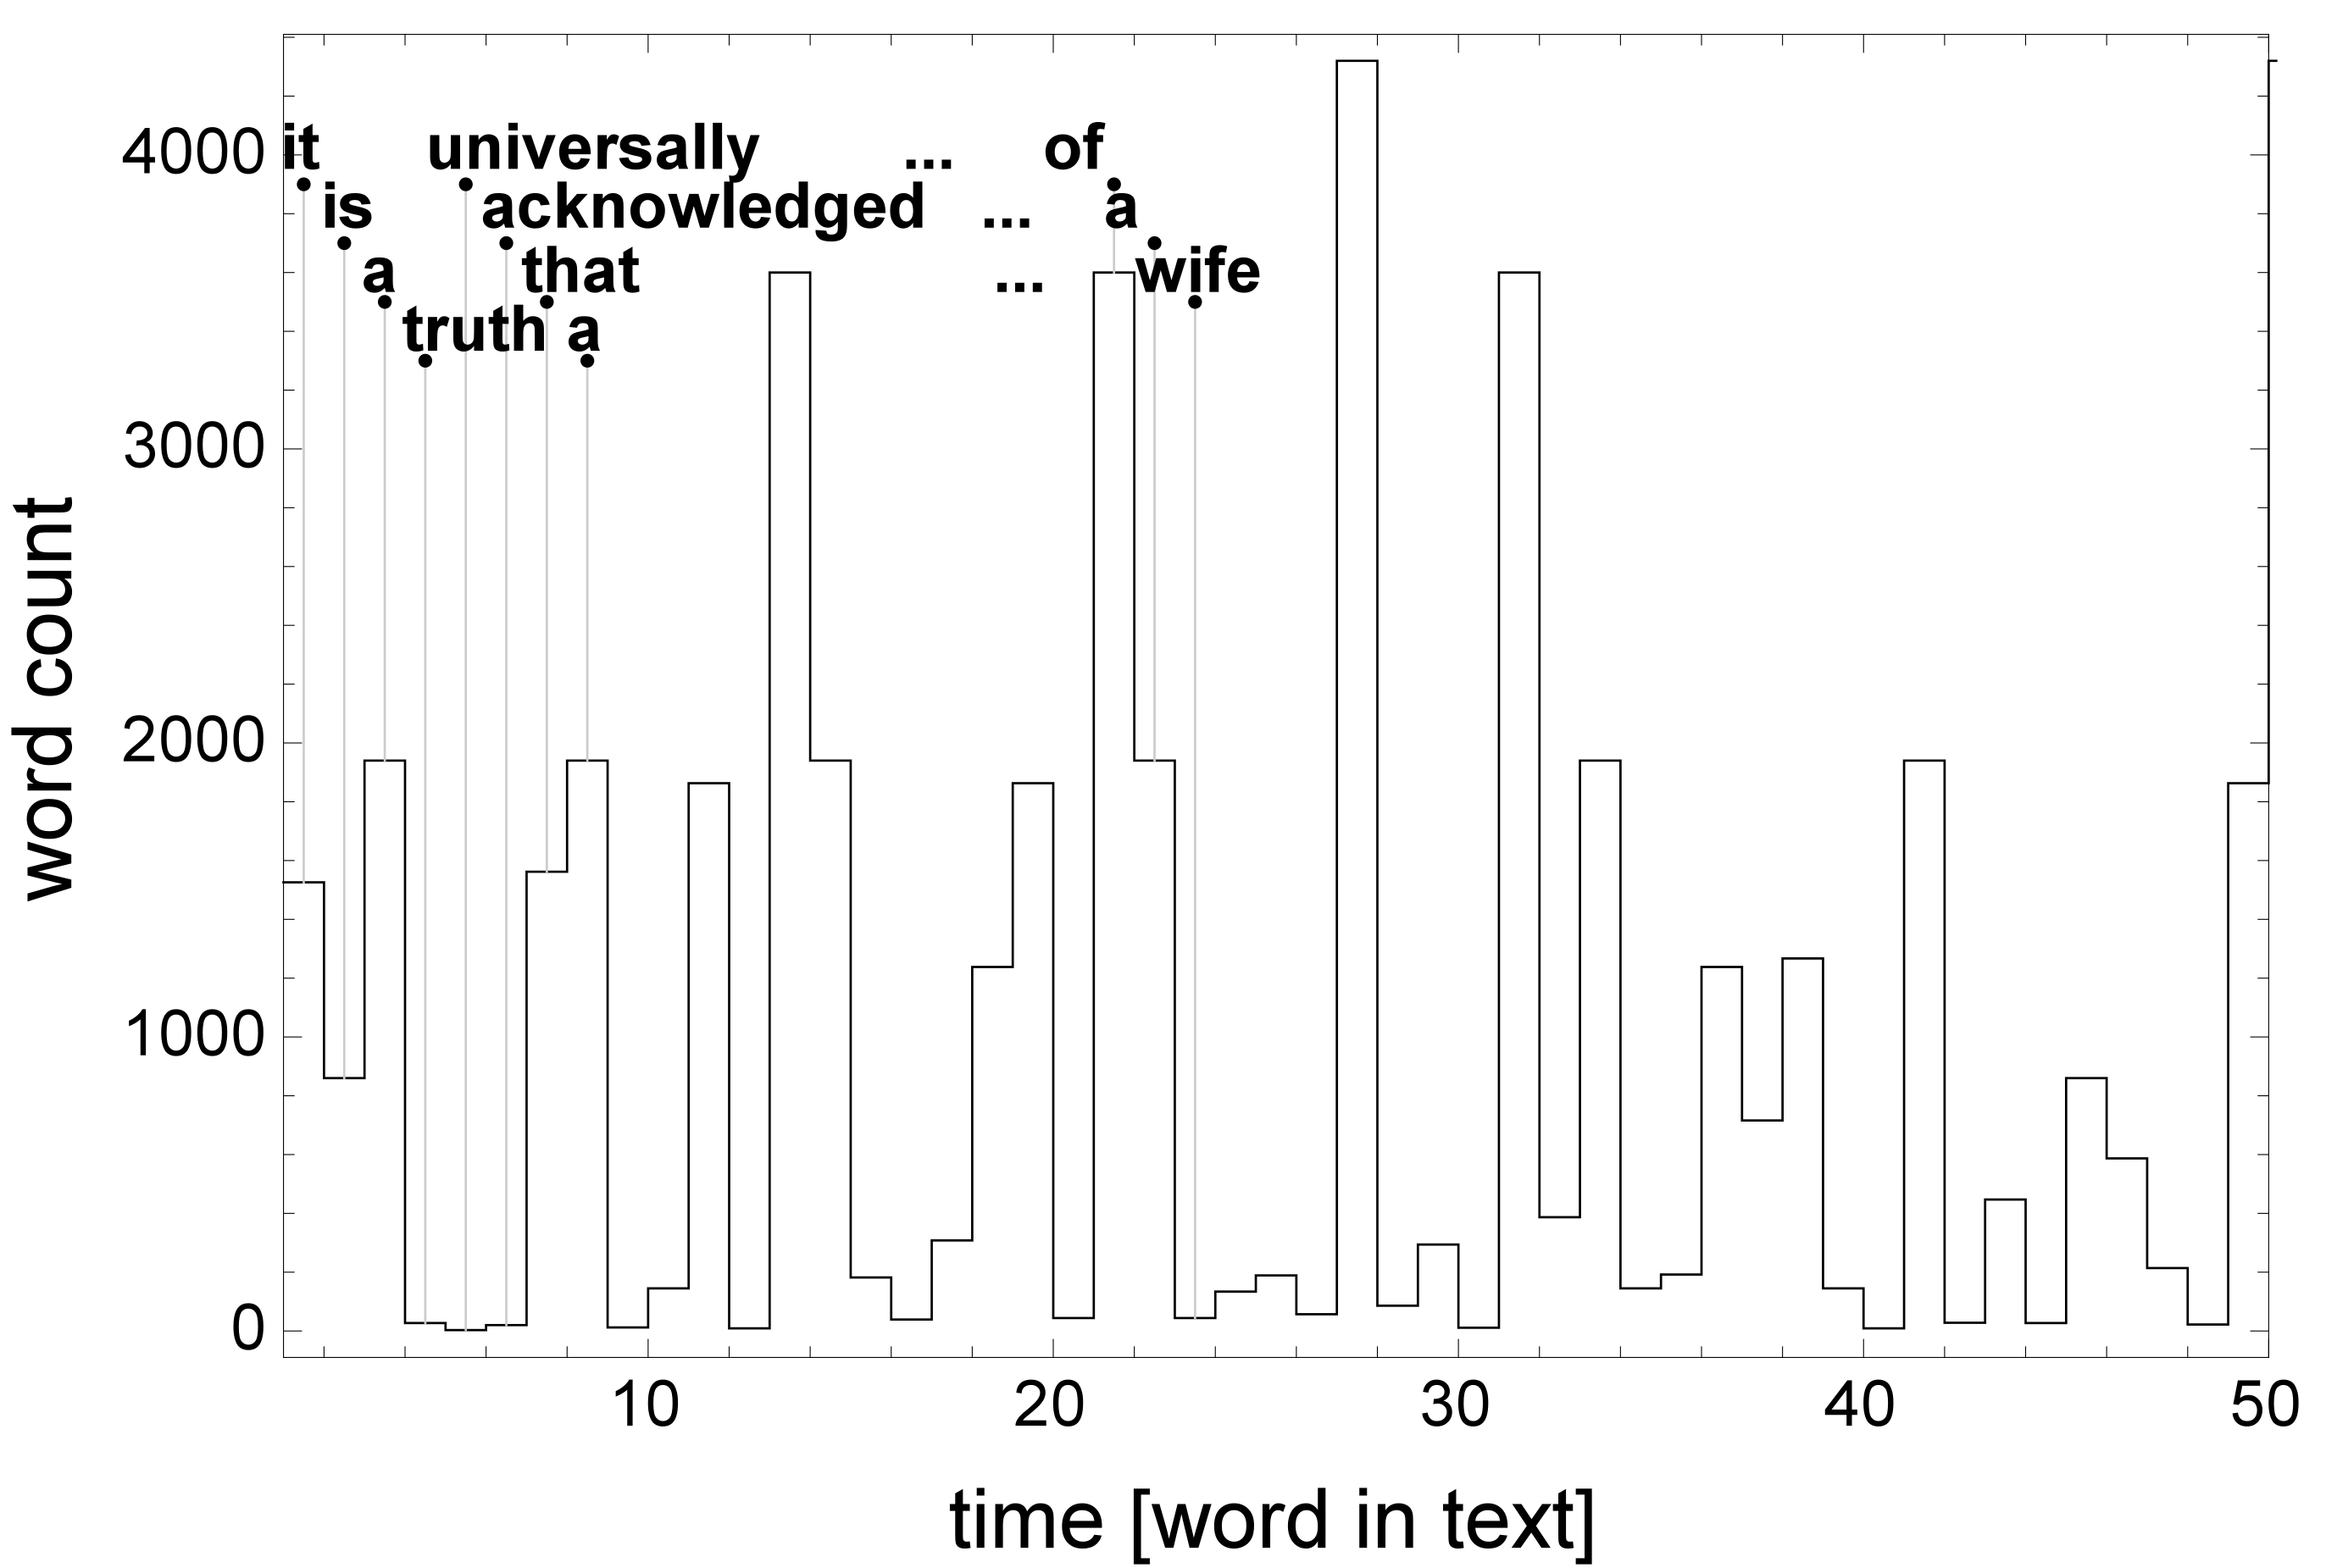
To quantify correlations in a script, successive symbols can be treated as a time-series with symbolic values (Stanley, 1992) or numeric positions on a word frequency list (Montemurro and Pury, 2002; Ausloos, 2012), see Fig. 1. Below, I use information extracted from such time-series as features in machine learning (ML) methods to increase accuracy of authorship attribution (AA) in a benchmark literary corpus.
2. Methods
2.1. Complexity measures
For a series, defined as ranks of words at consecutive positions in a text, following measures are used (formatted as Quantity: ML features):
Power spectrum: psLen, psExp
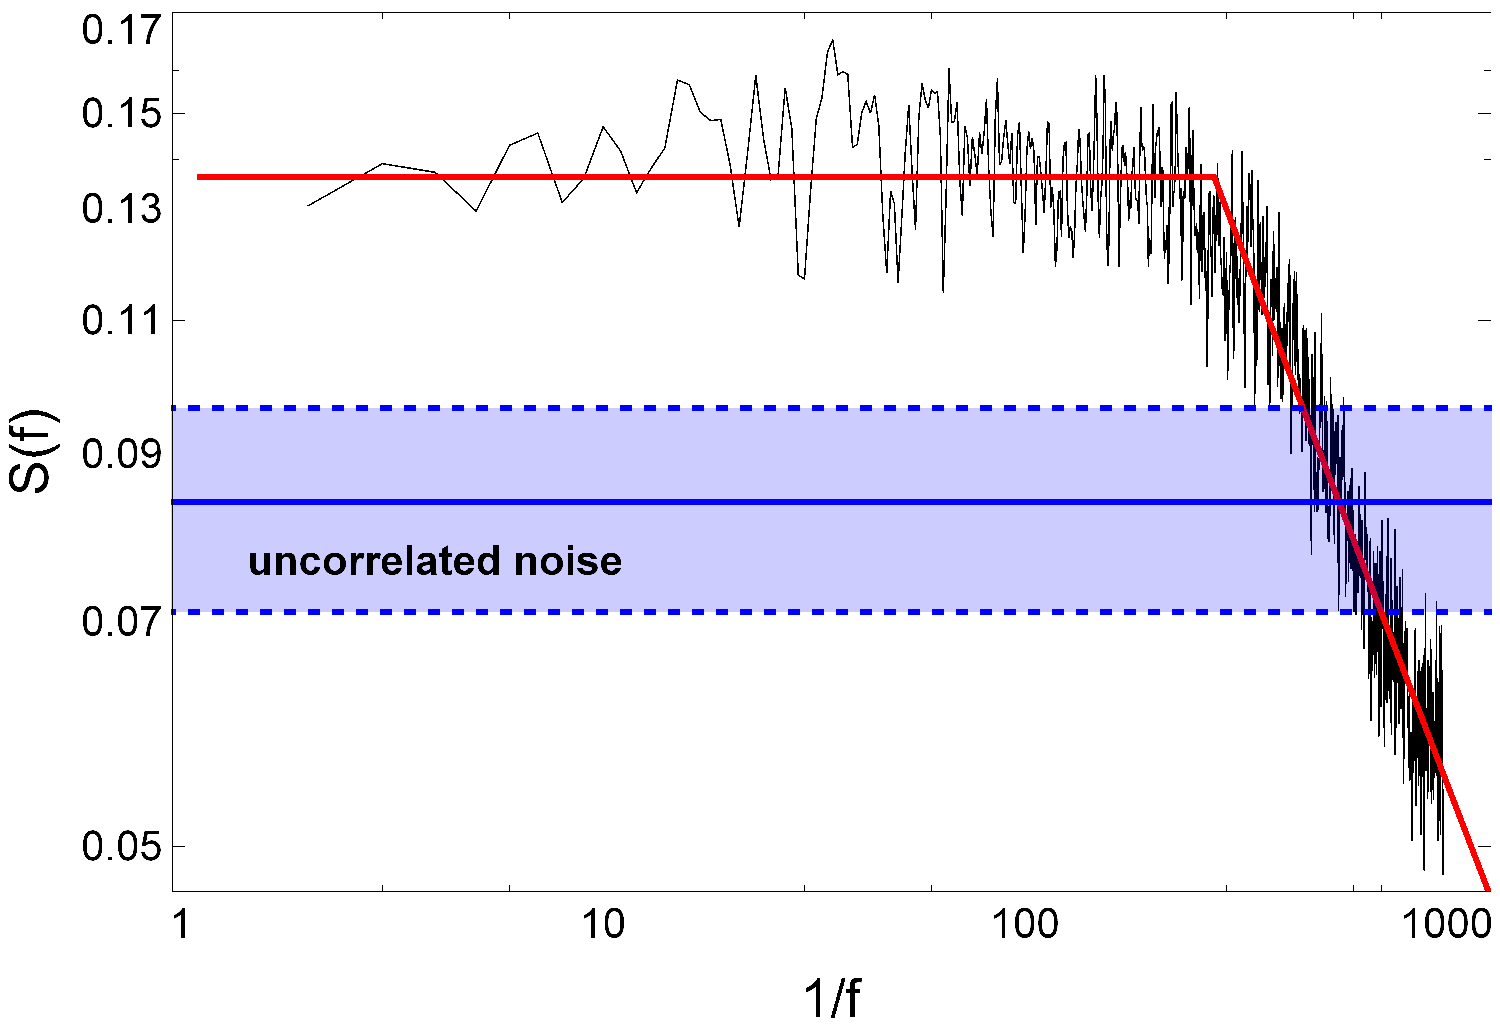
Power spectrum S(f) of a series at a frequency f can be interpreted as the strength of correlation of the series with itself at word-to-word distances 1/f. As Fig. 2 illustrates, it is described well by two parameters: the length psLen of the high-correlation plateau and the slope of its decay psExp.
Predictability: pred
As the name suggests, it measures how well can the next step in a series be predicted given previous steps (see definition: Stone, 1996).
Fano factor exponent: fanoF
Fano factor measures signal autocorrelation, especially in fractal processes (Thurner et al., 1997), as one takes increasingly bigger chunks of text – similarly to the slope of power spectrum or detrended fluctuation analysis (Grabska-Gradzińska et al., 2013).
Entropy rate of word variation: entExp, entConst
The entropy is maximal for equiprobable word occurences, and minimal when a single word is always used. As one reads a text, new words appear and the entropy grows, and saturates. entExp and entConst are characteristic time and a multiplicative constant of such a growth.
Static entropy: entLocM, entLocSD
For a window of a constant length moving across the whole text, the entropy fluctuates. Parameters entLocM and entLocSD are its mean and standard deviation.
2.2. Algorithm and parameters
AA was performed with the R package stylo (Eder et al., 2013) with settings: delta distance (Burrows, 2002), 1000-fold cross-validation, one book of each author in the training set. (None of the other ML methods (Stamatatos, 2009; Jockers and Witten, 2010) implemented in stylo did significantly better than Burrows’s delta.)
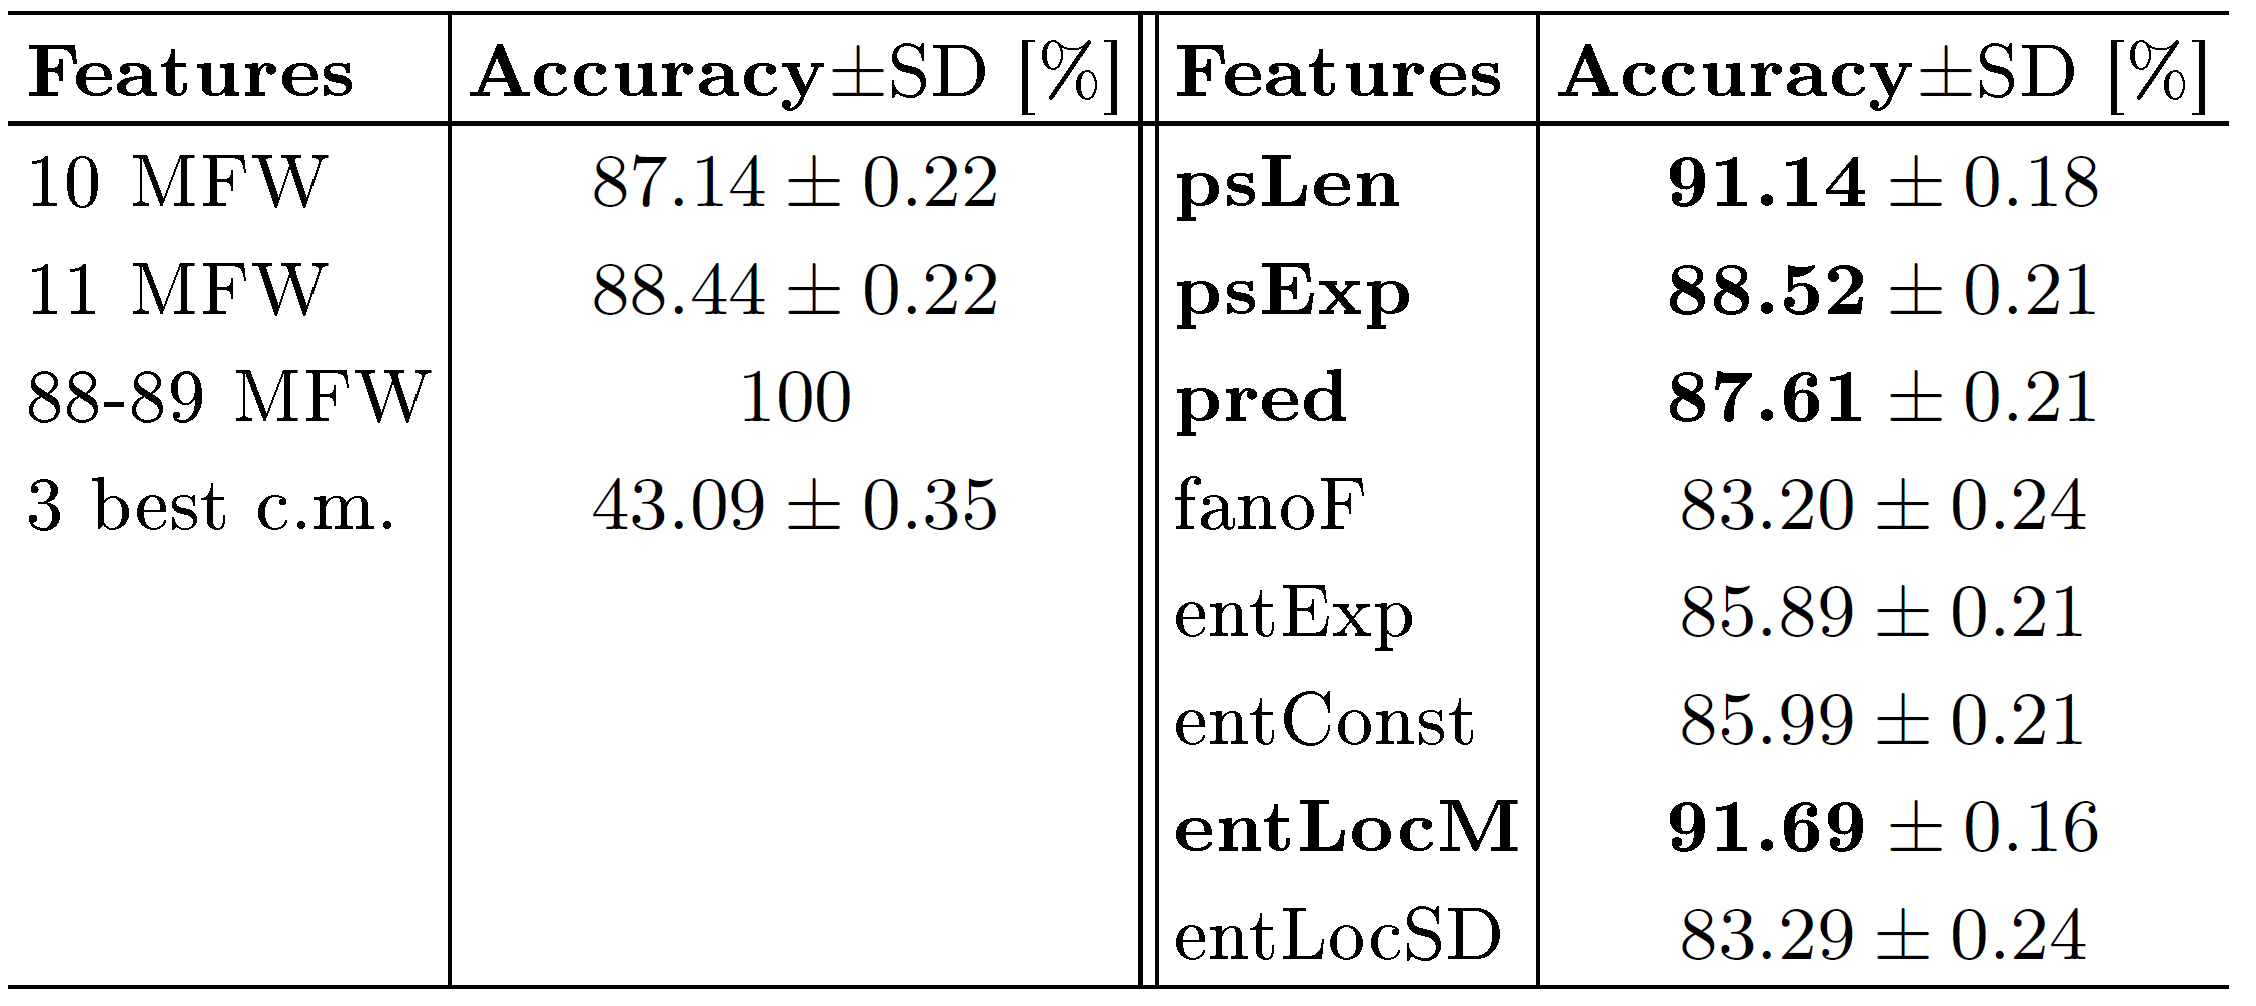
Since on this corpus about 90 most frequent words (MFW) are needed for 100% accuracy, only the first ten were used as features, which left room for improvement. Having precomputed all the eight measures, they were appended to the feature list.
3. Data
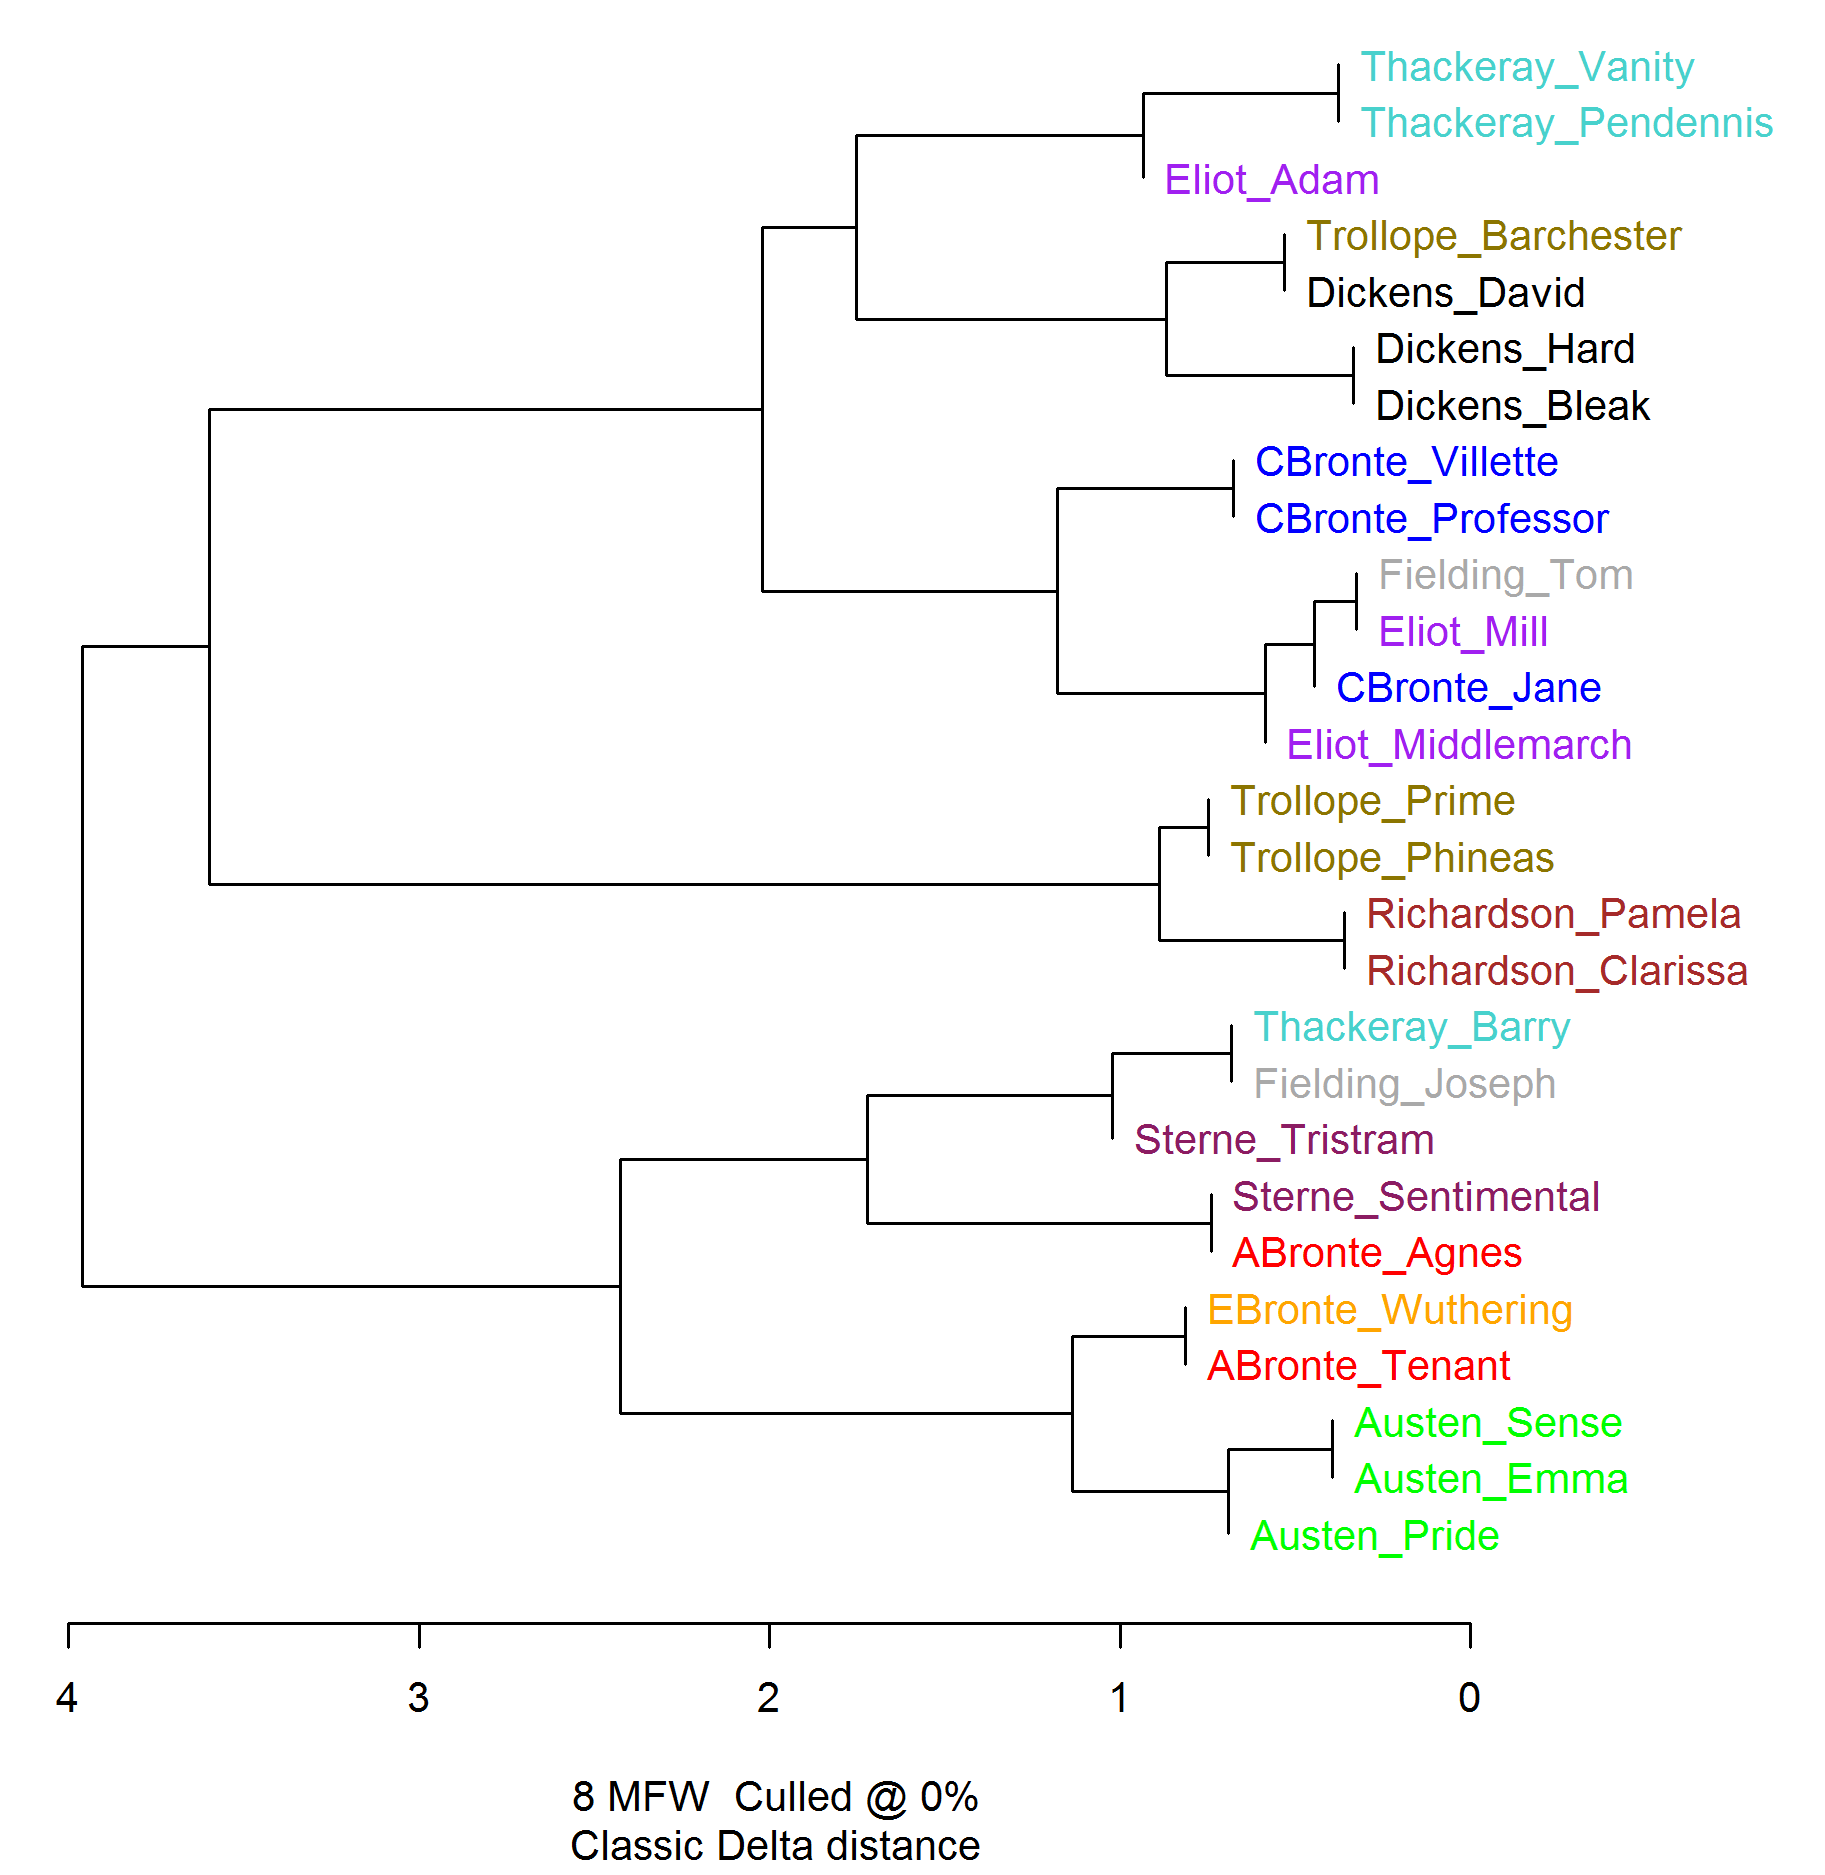
A corpus (Rybicki, 2015) comprising 27 classic British 19 th c. novels of 11 authors was used (see Fig. 3, where each leaf is a shorthand for a novel’s Author_Title). The reason for choosing this corpus is that many AA algorithms have been tested on it, and they perform very well, not least thanks to its size.
4. Results
4.1. Authorship attribution
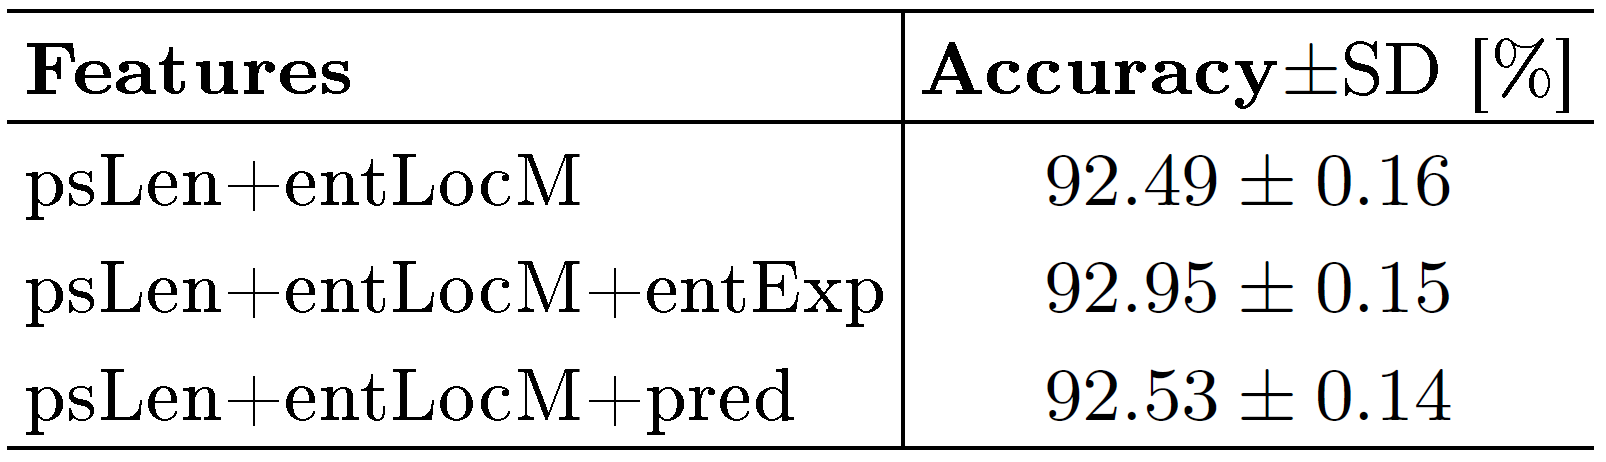
AA algorithms at best use 6-grams (Eder, 2011), whereas the correlations may reach hundreds of words, as demonstrated in Fig. 2. The results in Tables 1-2 show that the measures from Sec. 2.1 can aid ML. As a proof of concept, Fig. 3 shows a cluster analysis based exclusively on these complexity measures; although imperfect, it strongly indicates that the temporal characteristics contain traces of authorial style.
4.2. Informativeness of complexity measures
Surprisingly, psLen is not correlated with paragraph lengths (cf. Kosmidis et al., 2006). Its smallest values 280-300 come, intriguingly, from Austen and Anne and Emily Brontë, while the largest 370-390 from Dickens, Thackeray and Trollope.
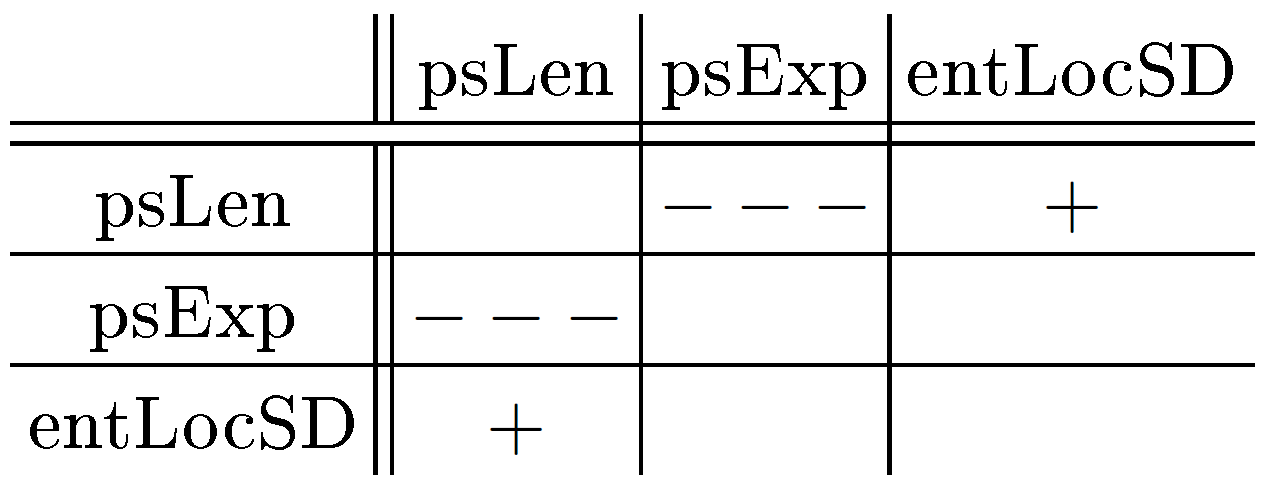
Note that correlated features (see Tab. 3 for a summary) worsen performance and should be eliminated. Remaining parameters are expected to contain non-overlapping information. Further, PCA analysis showed that psLen and entLocM contain the most distinctive information. Tables 1-2 show that indeed these parameters most significantly aid ML.
5. Conclusions
This preliminary study shows that measures reflecting long-range word-to-word correlations carry authorial information and enhance stylometric ML methods. More complex features than words and n-grams are needed.
6. Acknowledgements
I thank Maciej Eder for insightful discussions. The research was funded by Grant No. DEC-2013/09/N/ST6/01419 of the National Science Centre of Poland.
- Altmann, E. G., Cristadoro, G. and Esposti, M. D. (2012). On the origin of long-range correlations in texts, Proceedings of the National Academy of Sciences, 109: 11582–87.
- Ausloos, M. (2012). Generalized Hurst exponent and multifractal function of original and translated texts mapped into frequency and length time series, Physical Review E, 86: 031108.
- Burrows, J. F. (2002). "Delta": a measure of stylistic difference and a guide to likely authorship, Literary and Linguistic Computing, 17: 267–87.
- Drożdż, S., Oświęcimka, P., Kulig, A., Kwapień, J., Bazarnik, K., Grabska-Gradzińska, I., Rybicki, J. and Stanuszek, M. (2016). Quantifying origin and character of long-range correlations in narrative texts, Information Sciences 331: 32-44.
- Eder, M. (2011). Style-markers in authorship attribution: a cross-language study of the authorial fingerprint, Studies in Polish Linguistics, pp. 99–114.
- Eder, M., Kestemont, M. and Rybicki, J. (2013). Stylometry with R: a suite of tools. Digital Humanities 2013: Conference Abstracts. University of Nebraska-Lincoln, NE, pp. 487–89.
- Grabska-Gradzińska, I., Kulig, A., Kwapień, J., Oświęcimka, P. and Drożdż, S. (2013). Multifractal analysis of sentence lengths in English literary texts, AWERProcedia Information Technology and Computer Science 3: 1700-06.
- Jockers, M. L. and Witten, D. M. (2010). A comparative study of machine learning methods for authorship attribution, Literary and Linguistic Computing, 25: 15–223.
- Kosmidis, K., Kalampokis, A. and Argyrakis, P. (2006). Language time series analysis, Physica A: Statistical Mechanics and its Applications, 370: 808–16.
- Montemurro, M. A. and Pury, P. A. (2002). Long-range fractal correlations in literary corpora, Fractals 10: 451–61.
- Pawłowski, A. (1998). Séries temporelles en linguistique. avec application a lattribution de textes: Romain Gary et Émile Ajar. Travaux de linguistique quantitative, Vol. 62, Honoré Champion, Paris, Geneve: Champion-Slatkine.
- Pawłowski, A. (2011). Language in the line vs. language in the mass: On the efficiency of sequential modeling in the analysis of rhythm, Journal of Quantitative Linguistics 6: 70–77.
- Peng, C., Buldyrev, S., Goldberger, A., Havlin, S., Sciortino, F., Simons, M. and Stanley, H. (1992). Long-range correlations in nucleotide sequences, Nature, 356: 168–70.
- Rybicki, J. (2015). A short collection of British fiction. https://sites.google.com/site/computationalstylistics/corpora (accessed 23 February 2016).
- Stamatatos, E. (2009). A survey of modern authorship attribution methods, Journal of the American Society for Information Science and Technology, 60: 538–56.
- Stone, J. V. (1996). Perceptually salient visual parameters using spatiotemporal smoothness constraints, Neural Computation, 8: 1463–92.
- Thurner, S., Lowen, S. B., Feurstein, M. C., Heneghan, C., Feichtinger, H. G. and Teich, M. C. (1997). Analysis, synthesis, and estimation of fractal-rate stochastic point processes, Fractals, 5: 565–95.