Authors: Heather Richards-Rissetto
Category: Paper:Long Paper
Keywords: GIS, Mesoamerica, 3D Visualization, Visibility Analysis, Landscape Archaeology
An Iterative 3DGIS Analysis of the Role of Visibility in Ancient Landscapes
1. Introduction
Through the spatial arrangements of temples, houses, roads, and more, the built environment provides a window to human interaction (Lawrence and Low, 1990). Spatial configurations influence how people negotiate their surroundings. People “read environmental cues, make judgments…and then act accordingly” (Rapoport, 1990: 139), and these decisions in turn, affect the frequency and intensity of interaction (Fletcher 1981). While many factors influence interaction within landscapes, in this paper I focus on visibility.
The visibility, intervisibility, and invisibility of features communicate information that guides pedestrian movement, and consequently, structures social interaction and community organization (Llobera, 2003, 2006; Gillings, 2015). Building on these ideas, this paper uses Geographic Information Systems (GIS) and 3D visualization to explore the role of visibility in ancient landscapes asking: How might visibility influence where people went, what they did, who interacted with whom, and how did these interactions shape their daily experiences?
2. Case Study: Copan, Honduras
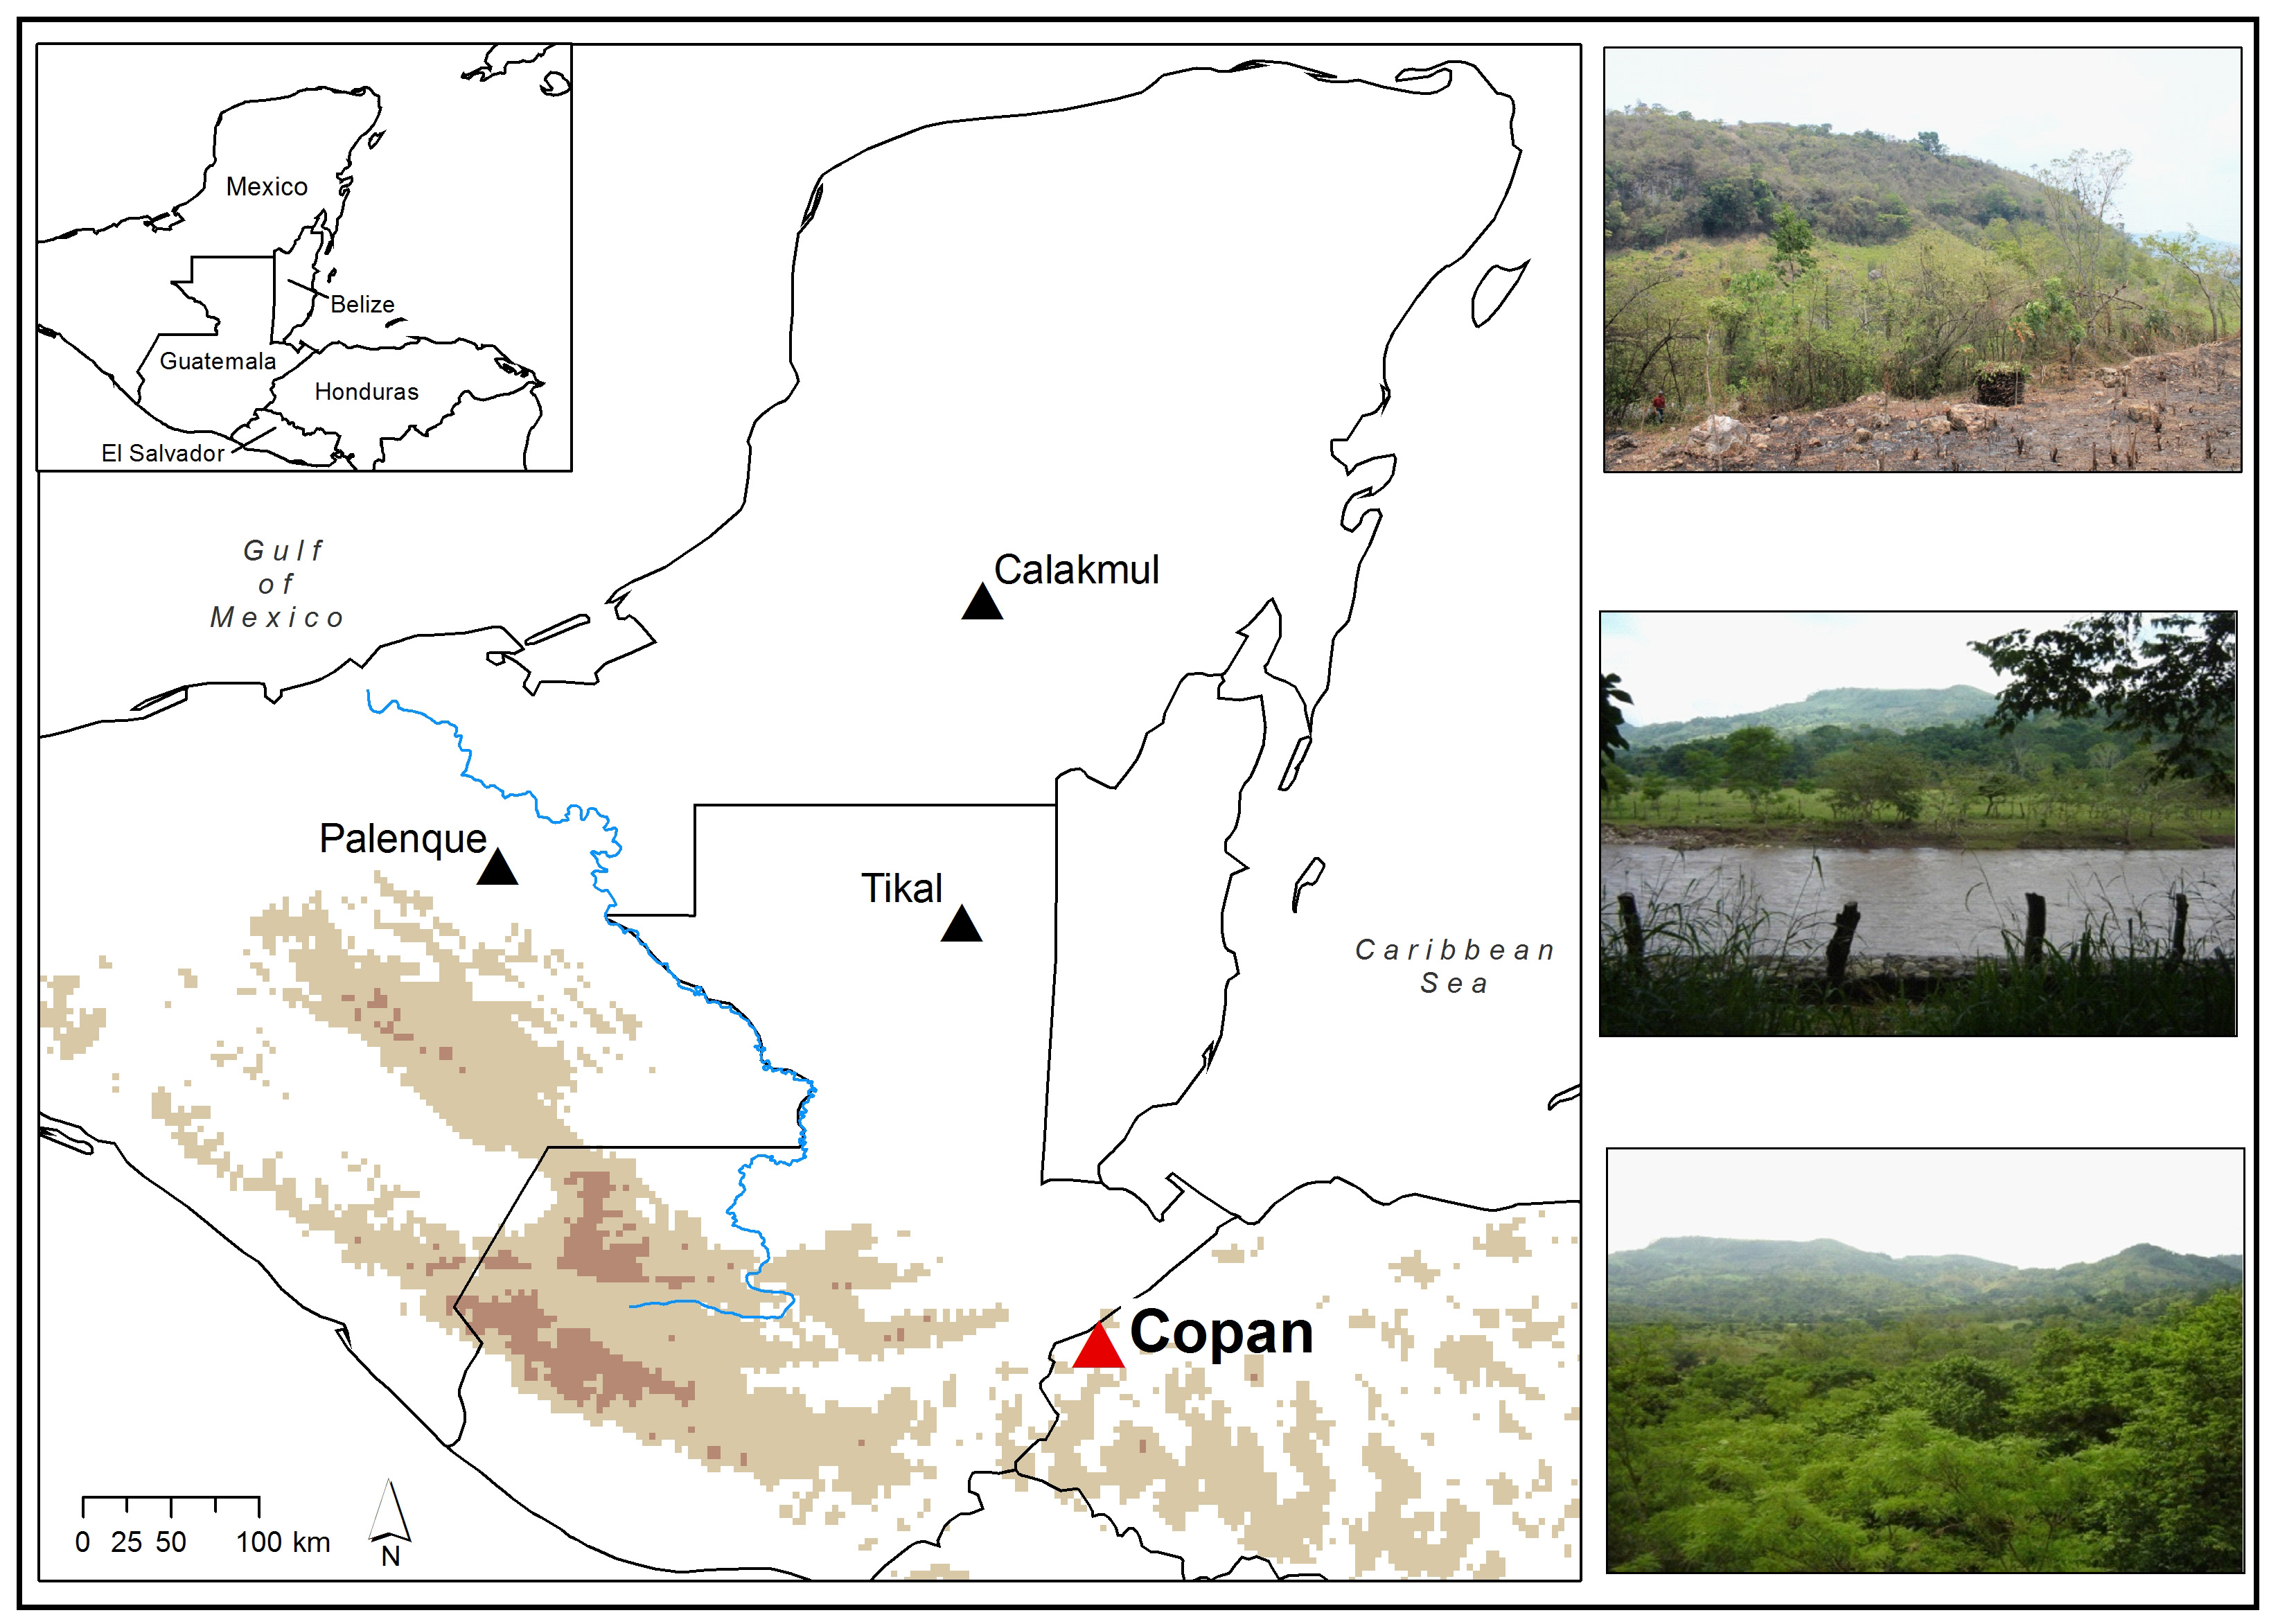
The case study is the ancient Maya polity of Copan (Figure 1) ruled for over four-hundred years by a line of dynastic kings who by the late eighth century were facing mounting sociopolitical and environmental problems (Fash, 2001). Copan’s final dynastic ruler, Yax Pasaj, like the rulers of many other Maya polities, was coping with strenuous environmental, demographic, and sociopolitical circumstances that would ultimately lead to the kingdom’s demise. Yet during this time of stress, it seems that Yax Pasaj carried out a major urban renewal project commissioning several new temples in the city center that elevated Copan’s skyline. Given the changes to Copan’s urban fabric, Yax Pasaj’s reign is an ideal case study to investigate the role visibility may have played in the production or reproduction of social interaction among the ancient Maya.
At Copan, as at other Maya centers, imagery on ceramics, murals, and freestanding monuments depicted deities floating over lords who subsequently looked down over lower-ranking persons. Maya architecture replicated this vertical succession by elevating royal compounds above other architecture, and in essence linking Maya rulers to the heavens (Messenger, 1987). In terms of visibility, epigraphic decipherments indicate that “seeing” afforded high status, and sight had an authorizing gaze and witnessing function—similar to Foucault’s (1995) Panoptic gaze—where those who were all-seeing were all-knowing (Houston et al. 2006: 173). In order to be all-seeing or to give such an impression, however, Maya rulers needed to be seen, and so often located themselves in physically high and easily visible places or built tall temples that dominated the landscape.
While we know that Maya kings typically constructed highly visible temples, we actually know very little about the role visibility may have played in structuring social connections and daily interactions among social groups. To do this we need to broaden our view from civic-ceremonial precincts to encapsulate the broader landscape (Doyle et al., 2012; Richards-Rissetto 2010; Landau, 2015).
3. Background: GIS & 3D Visualization
Early visibility studies in the Maya region focused on astronomical alignments among structures, freestanding monuments, and the sky (Aveni and Hartung, 1986). Later, ethnographic studies showing that contemporary Maya often use sight lines to mark out spaces (Hanks, 1990) inspired researchers to investigate whether non-astronomical lines-of-sight also existed at ancient sites; and in fact, archaeologists identified sight lines between a major temple and outlying stelae at the site of La Milpa, Belize (Hammond and Tourtellot, 1999). Recent research has moved away from lines-of-sight between two objects to study the relationships that an object may have to the many objects or features found within a landscape, referred to as a visualscape (Llobera, 2003). Simple line-of-sight measurements cannot provide data on the relationships among multiple objects because they are done along a fixed line; however, visualscapes can be measured using viewsheds that calculate an object‘s entire 360° field-of-view using GIS.
A GIS links mapped features to attributes stored in a database and overlays different data layers such as land usage, elevation, and buildings to help reveal complex patterns, relationships, and trends that are not readily apparent using other tools such as traditional databases not linked to maps.
Pros: In regard to visibility analysis, GIS allows archaeologists to move beyond line-of-sight analysis to viewshed analysis. A viewshed uses raster data (pixels) to identify all cells visible from one or more viewpoints in a landscape; all non-visible cells are assigned a 0 and all visible cells are assigned a 1. This basic binary schema allows for complex mathematical calculations, for example, Boolean operations or map algebra, to calculate topographic prominence of individual features (or classes of features) and percentage of intervisibility among features.
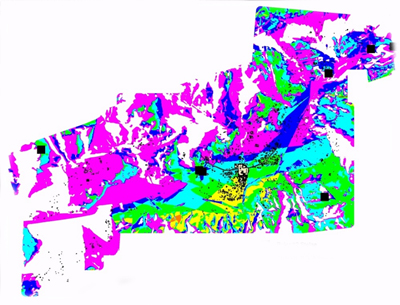
Cons: “Viewsheds depicted in a GIS map bear little resemblance to what people experience on the ground” (Conolly and Lake, 2006: 233). This limitation occurs because viewshed data are 2.5D. In other words, viewsheds store heights and elevation, but they are not actually 3D models (Figure 2). For digital humanists, these flat maps lack a sense of mass, scale, and aesthetics integral to human perception and experience, and the numerical outputs fail to differentiate visibility of a building’s façade versus its sides or back—essential for close reading interpretation. Technically, data resolution (i.e., ratio of pixel size to earth’s surface) can dramatically affect viewshed results—low spatial resolution often masking variation and too high a spatial resolution underestimating visibility (King et al., 2015).
3D technologies offer an alternative to GIS. 3D data acquisition (e.g., airborne LiDAR, terrestrial laser scanning, and photogrammetry), 3D modeling (e.g., SketchUp, 3D StudioMax, Agisoft), and interactive 3D visualization (e.g., Unity, Oculus Rift) are transforming archaeological practice. But, what impact are such 3D technologies having on visibility analysis across ancient landscapes? Airborne LiDAR, for example, rapidly collects 3D data for archaeological sites across vast areas (Thompson and Prufer, 2015). Most LiDAR data are of unexcavated mounds requiring subsequent 3D modeling of architecture and proper alignment within terrains in order to perform visibility analysis—traditionally time-consuming tasks (Richards-Rissetto, 2013).
While most visibility analyses of archaeological landscapes use traditional 2.5D GIS, recently archaeologists have been exploring the potential of 3D approaches for visibility analysis in archaeology. Paliou (2014) developed a computational visibility approach to analyze the visual range of paintings first using 3D modeling programs (3DStudioMax and AutoCAD) and then converting the results into raster maps to be analyzed in a GIS. Dell’ Unto and colleagues (2015) bring georeferenced 3D architectural models (using laser scanning and photogrammetry) into a GIS to calculate visibility of building interiors at Pompeii. While Saldana and Johanson (2015) also use 3DGIS, they employ procedural modeling to rapidly generate alternative 3D building reconstructions based on a set of architectural rules and attributes stored in a GIS to explore visibility in Ancient Rome (Saldana, 2015).
4. Methods
Building on this scholarship, I employ an iterative 3DGIS approach to explore the role of visibility at the ancient Maya site of Copan—today a UNESCO World Heritage Site in Honduras. The approach is twofold: computational and experiential. In the computational approach, I employ traditional 2.5D viewshed analysis in GIS to establish a baseline for comparative analysis with viewshed results in 3DGIS.
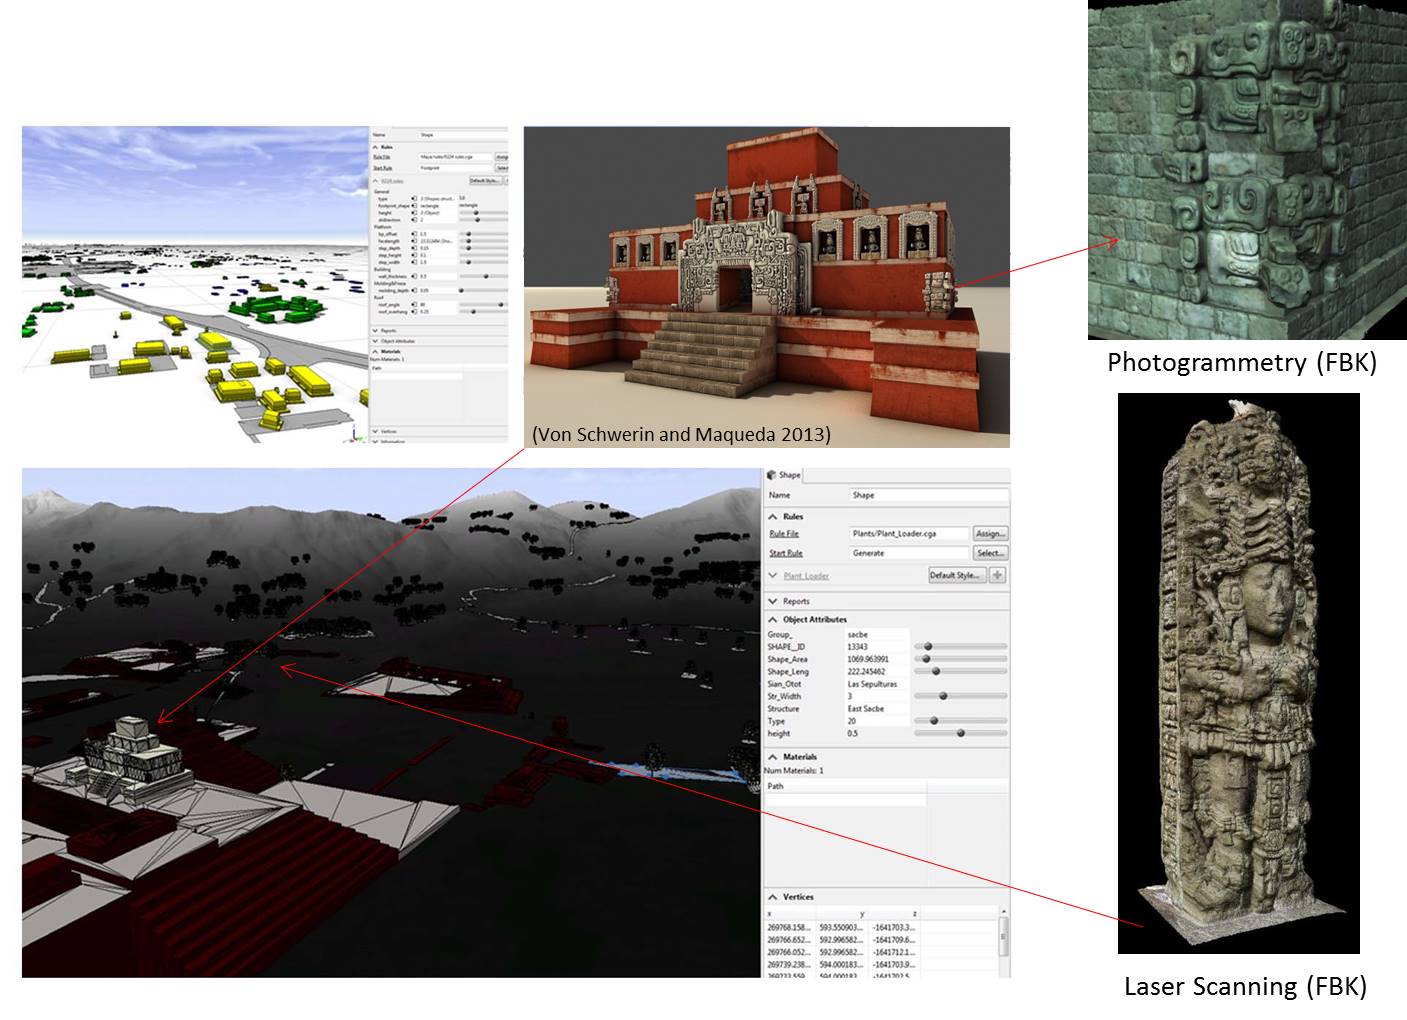
First, I use ArcGIS 10.3 (standard GIS software) to assign known building heights and interpolate building heights of unexcavated mounds and run viewsheds to calculate topographic prominence and percent visibility in relation to settlement of major temples and classes of architecture (Richards-Rissetto, 2013). Recent acquisition of airborne LiDAR data has generated a 1m resolution terrain allowing for greater accuracy than earlier visibility analyses (Richards-Rissetto, 2010; von Schwerin et al., 2016). Second, I employ CityEngine—a procedural modeling program that convert GIS data to 3D models—to generate 3D models for Copan’s 3,000+ buildings with the LiDAR terrain using the GIS data and a set of architectural rules as well as laser scanned and photogrammetric models of some standing monuments at Copan (Figure 3) (Muller et al., 2006; Richards-Rissetto and Plessing, 2015; von Schwerin et al., 2013). These procedurally-generated 3D models are then returned to ArcScene (a 3D viewer for ArcGIS) and the viewshed analysis is rerun for comparative analysis of 2.5DGIS vs. 3DGIS of visibility at ancient Copan.
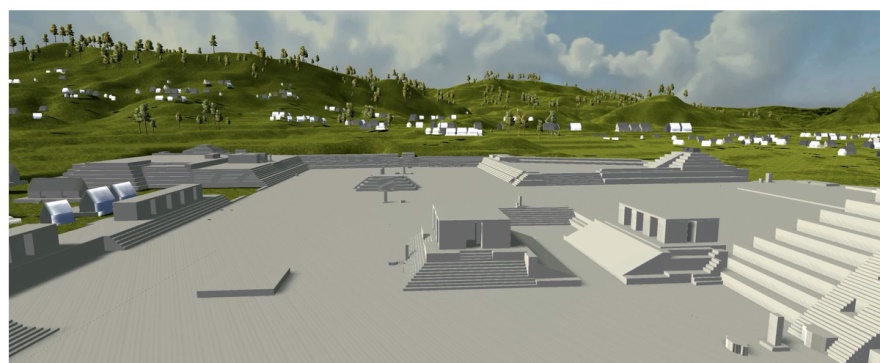
In the experiential approach, I export the 3D models and terrain from CityEngine into Unity 5—a gaming engine—to interactively explore the 3D models. In this model, vegetation is added to the landscape and avatars proceed along set paths generated from a combined cost surface and visibility analysis (Figure 4) (Richards-Rissetto, 2013; Richards-Rissetto and Landau, 2014). Oculus Rift—a head-mounted virtual reality display—is employed to create an immersive experience for ancient Copan as a means to more intuitively interact with archaeological data (Bartolo et al., 2000; Frisher and Dakouri-Hild, 2008).
5. Discussion
Strongly embedded in the Digital Humanities, this 3DGIS iterative approach tacks back and forth between 2.5D and 3D data to compare results and potentially derive new methods and interpretations for visibility analysis of ancient landscapes—analyses that would not be possible without taking advantage of the digital to cross-cut the computational and experiential.
6. Acknowledgements
The Layman Award, University of Nebraska-Lincoln provided a seed grant to carry out initial procedural modeling tests. This research would not be possible without permission and assistance from the Honduran Institute of Anthropology and History (IHAH). The MayaArch3D Project has generously providing the airborne LiDAR data and the laser scanned and photogrammetric models for this research. I want to thank UNL students Zachary Day, Stephanie Sterling, and Rachel Plessing for their important work on the visualizations.
- Aveni, A., and Hartung, H. (1986). Maya City Planning and the Calendar. Transactions of the American Philosophical Society, 0065-9746, Vol. 76, pt. 7. Philadelphia: American Philosophical Society.
- Barcelo, J., Forte, M. and Sanders, D. (Eds.) (2000). Virtual reality in archaeology. Oxford: Archaeopress.
- Conolly, J. and Lake M. (2006). Geographical Information Systems in Archaeology. Cambridge University Press.
- Dell’ Unto, N., Landeschi, G., Leander, T., Touati, A., Dellepiane, M., Callieri M. and Ferdani, D. (2015). Experiencing Ancient Buildings from a 3D GIS Perspective: a Case Drawn from the Swedish Pompeii Project. Journal of archaeological method and theory.
- Doyle, J., Garrison, T. and Houston, S. (2012). Watchful Realms: integrating GIS analysis and political history in the southern Maya lowlands. Antiquity, 86(333): 972-807.
- Fash, W. (2001). Scribes, Warriors, and Kings: The City of Copan and the Ancient Maya. Thames and Hudson, London.
- Fletcher, R. (1981). People and Space: A Case Study on Material Behavior. In Pattern of the Past: Studies in Honour of David Clarke, edited by I. Hodder, G. Issac, and N. Hammond, Cambridge University Press, Cambridge, pp. 97-128.
- Foucault, M. (1995). Discipline and Punishment. Vintage Books, New York.
- Frisher, B. and Dakouri-Hild, A. (Eds.) (2008). Beyond Illustration: 2D and 3D Digital Technologies as Tools for Discovery in Archaeology, BAR International Series 1805. Oxford: Archaeopress, 2008
- Gillings, M. (2015). Mapping invisibility: GIS approaches to the analysis of hiding and seclusion. Journal of Archaeological Science 62: 1–14
- Hammond, N. and Tourtellot G. (1999). Shifting Axes: Spatial Expressions of Power at La Milpa. Paper presented at the 64 th Annual Meeting, Society for American Archaeology. Chicago, IL. March 27th.
- Hanks, W. (1990). Referential Practice: Language and Lived Space among the Maya. The University of Chicago Press, Chicago and London.
- Houston, S., Stuart, D. and Taube, K. (2006). The Memory of Bones: Body, Being, and Experience among the Classic Maya. University of Texas, Austin.
- King. J., Richards-Rissetto, H. and Landau K. (2015). Enter the Void: A GIS Analysis of the Visibility of Empty Spaces at Copan, Honduras. Paper presented at Society for American Archaeology 80th Annual Meeting, San Francisco, CA. April 2015.
- Landau, K. (2015). Spatial Logic and Maya City Planning: The Case for Cosmology. Cambridge Archaeological Journal 25(1): 275-92.
- Lawrence, D. and Low, S. (1990). The Built Environment and Spatial Form. Annual Review of Anthropology 19: 453-505.
- Llobera, M. (2003). Extending GIS Based Analysis: The Concept of the Visualscape. International Journal of Geographic Information Science 1(17): 25-48.
- Llobera, M. (2006). What you see is what you get?: Visualscapes, visual genesis and hierarchy. In Digital Archaeology: Bridging Method and Theory, (Ed) P. Daly and T. Evans, Routledge, Taylor and Francis, New York and London, pp. 148-67.
- Messenger, L. (1987). Community Organization of the Late Classic Southern Periphery of Mesoamerica: Expressions of Affinity. In Interaction on the Southeast Mesoamerican Frontier: Prehistoric and Historic Honduras and El Salvador, In E. J. Robinson (Ed), BAR International Series 327 (ii), pp. 385-420.
- Muller, P., Vereenooghe, T., Wonka, P., Papp, I. and van Gool L. (2006). Procedural 3D reconstruction of Puuc buildings in Xkipché. 7th International Symposium on Virtual Reality, Archaeology and Cultural Heritage, VAST. M. Ioannides, D. Arnold, F. Niccolucci, and K. Mania (Ed).
- Paliou, E. (2014). Visibility analysis in 3D built spaces: a new dimension to the understanding of social space. In Spatial analysis and social spaces: Interdisciplinary approaches to the interpretation of prehistoric and historic built environments, E. Paliou, U. Lieberwirth, and S. Polla (eds). Series: Topoi – Berlin Studies of the Ancient World 18.
- Rapoport, A. (1990). The Meaning of the Built Environment: A Nonverbal Communication Approach. University of Arizona Press: Tucson.
- Richards-Rissetto, H. (2010). Exploring Social Interaction at the Ancient Maya City of Copán,
- Honduras: A Multi- Scalar Geographic Information Systems (GIS) Analysis of Access and Visibility. Unpublished PhD: University of New Mexico.
- Richards-Rissetto, H. and Plessing, R. (2015). Procedural modeling for ancient Maya cityscapes: Initial methodological challenges and solutions. Proceedings for Digital Heritage International Congress 2015, Granada, Spain.
- Richards-Rissetto, H. (2013). From mounds to maps to models: visualizing ancient architecture across landscapes. Proceedings of Digital Heritage International Congress 2013, Marseille, France.
- Richards-Rissetto, H. and Landau, K. (2014). Movement as a means of social re(production): Using GIS to measure social integration in urban landscapes. Journal of Archaeological Science 41: 365-75.
- Saldaña, M. (2015). An Integrated Approach to the Procedural Modeling of Ancient Cities and Buildings. Digital Research in the Humanities (print volume forthcoming).
- Saldaña, M. and Johanson, C. (2013). Procedural Modeling for Rapid-Prototyping of Multiple Building Phases and Hypothetical Reconstructions of Early Rome. International Archives of the Photogrammetry, Remote Sensing and Spatial Information Sciences, Vol. XL-5/W1.
- Thompson, A. and Prufer, K. (2015). Evaluating airborne LiDAR for detecting settlements and modified landscapes in disturbed tropical environments at Uxbenka, Belize. Journal of Archaeological Science 57: 1-13.
- von Schwerin, J., Richards-Rissetto, H., Remondino, F. and Agugiaro G. (2013). The MayaArch3D Project: A 3D WebGIS for Analyzing Ancient Maya Architecture and Landscapes at Copan, Honduras. Literary and Linguistic Computing. Oxford University Press.
- Von Schwerin, J., Richards-Rissetto, H., Remondino, F., Grazia Spera, M., Auer, M., Billen, N., Loos, L. and Reindel M. (2016). Airborne LiDAR Acquisition, Post-Processing and Accuracy-Checking for a 3D WebGIS of Copan, Honduras. Journal of Archaeological Science Reports.