Authors: Paul Girard, Béatrice Dedinger, Donato Ricci, Benjamin Ooghe-Tabanou, Mathieu Jacomy, Guillaume Plique, Grégory Tible
Category: Paper:Long Paper
Keywords: interaction design, trade history, exploratory data analysis, data uncertainty, information design
RICardo Project : Exploring 19th Century International Trade
RICardo ( Research on International Commerce) is a database gathering bilateral flows of international commerce extracted from a large number of historical statistical sources during the 1787-1938 period. The foundational principles of this database are described in a working paper (Dedinger and Girard, 2015) submitted to the Historical Methods journal. This database begun to be developed by researchers in Economy and History in 2004 with the goal of renewing research on the history of trade globalization. In 2013, an entire new direction was given to the RICardo project. Economists and historians worked together with data scientists and designers in order to build a completely innovative digital tool susceptible to be used for both teaching and research 1.
1. Exploring international trade during the 19 th century
To this day, there is no equivalent digital resource to the RICardo database that focuses on such an ancient and lengthy time period. The only comparable tools are web applications from the IMF ( data . imf . org), the WTO ( stat . wto . org) and the United Nations ( comtrade . un . org) that offer data and visualizations on commerce during the post-50’s period. As we will show, the methodological problems posed by historical trade statistics (19 th-20 th centuries) are more complex. The first result of our work is a web application 2 available online: http://ricardo.medialab.sciences-po.fr. The database will be publicly released in 2017 upon the start of an international conference marking the two-hundredth anniversary of the publication of Ricardo’s main work (Ricardo, 1817).
We will discuss the methodological choices made during the creation of this data exploration tool – what we call datascape (Latour et al., 2012) – and will quickly present the research and educational perspectives that the tool allows for, before concluding on the method of transdisciplinary work that was used.
2. Representing data in their uncertainty
In RICardo, the basic informational unit is a trade flow (exportation or importation) between a reporting unit and a partner unit. In its present version, the database contains 267 000 flows. The partners are the commercial partners recorded in the annual trade statistics reports of the reporting countries. The large spatial and temporal coverage of the database raises certain problems. First off, the entities cover very heterogeneous realities: partners can be countries (“United Kingdom”), groups of countries (“United Kingdom & Ireland”) or geographic areas (“British colonies”). Further, the availability of trade statistics before the end of the 19 th century is very problematic (Dedinger and Girard, 2015), which is translated into an absence, in the database, of a non-negligible (17 000) amount of flows throughout the observed period. The challenge we then had to take up was to aggregate heterogeneous data without crushing the corpus’ complexity and accounting for missing data in the series. We attempt to resolve this thorny question by the exploratory analysis of the data (Tukey, 1977).
3. Three levels of exploration
The exploration interface developed offers three levels of entry from global to local: world view, country view and bilateral view. Each representation offers a specific point of view on the data within the database. The complexity increases as we move from the world view ( World) to the national point of view ( bilateral). In order to lead the exploration throughout these different levels, we have decided to construct a common structure to all three viewpoints.
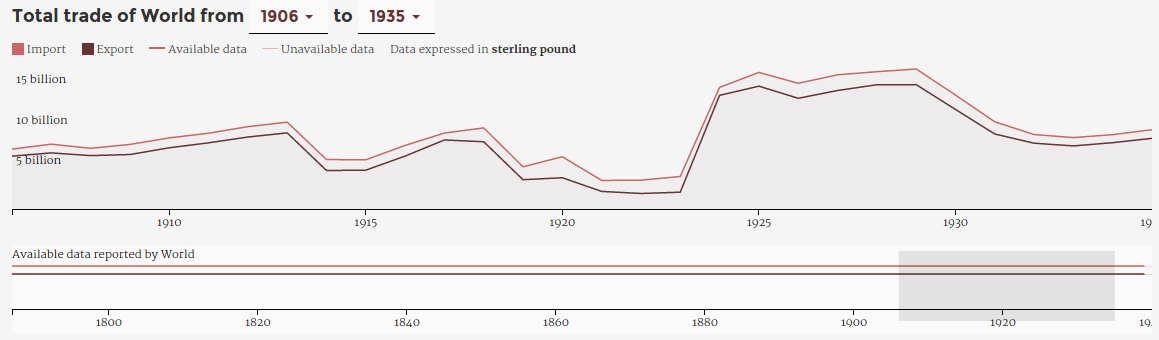
Each one opens unto a main curve representing total flows per year (representation of countries’ total trade for the world view, of one country’s total trade for the country view, or tradebetween two specific countries for the bilateral view) in addition to temporal limits. It is represented as a discontinuous line that is interrupted when there is no known value. In addition, these discontinuities appear also in an underlying temporal axis, indicating the absence of data in the form of a projection on the X-axis. This graphic object is also useful as an interface for temporal filtering: one can graphically select a sub-period to study more specifically (Becker and Cleveland, 1978). As footer for each view’s page, a spreadsheet allows to navigate within the visualized source data and export it as spreadsheet format (CSV). This way, the user can continue the analysis in an external statistical tool. At the center of this common structure, each view offers more detailed exploration.
4. Studying a country through the prism of its partners
The country view allows users to center their analysis on a reporting country by representing annual trade balances with each partner under the form of histograms.
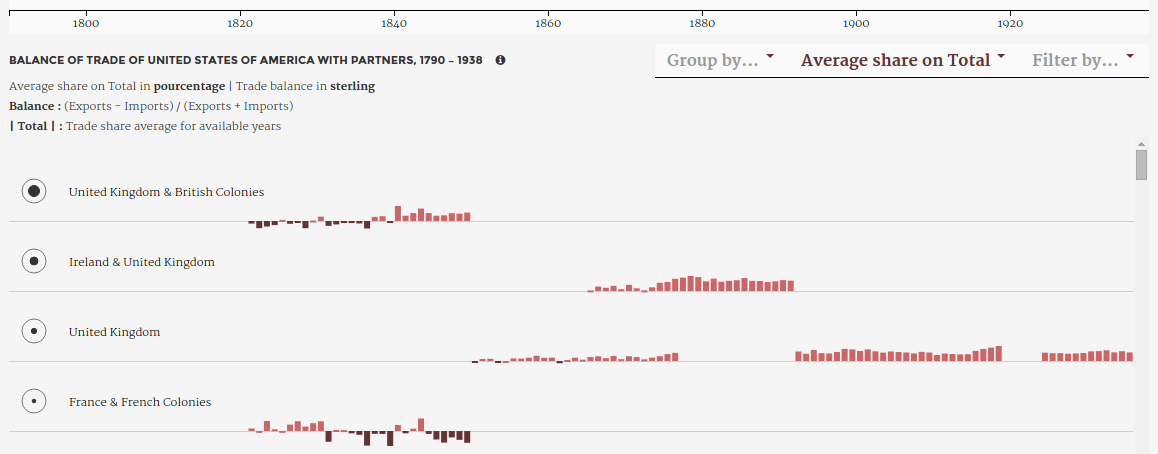
This use of small multiples (Tufte, 1990) facilitates comparisons between partners. The choice of detailing trade balances per year holds the fact that an aggregation on the entirety of the period would have introduced a bias by masking the year in which some data is missing. Furthermore, the ordering of the partners corresponds to the average annual share of each partner on the available years. This metric, represented as a circle at the start of the line, allows on the one hand to display the partners by decreasing importance, and on the other hand to let appear similar partner entities. Figure 2 therefore shows that “Ireland & United-Kingdom” and “United Kingdom” were the 2 nd and 3 rd partners of the United States during the 19 th century. They are two different entities but a similar partner in reality: the United Kingdom (the overlapping of years 1864-1876 is a consequence of the inclusion of two different sources).
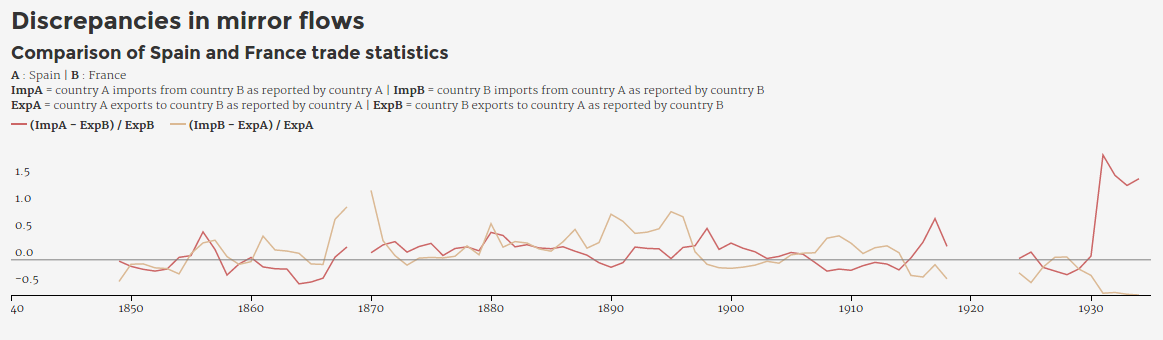
5. The distorting mirror of bilateral trade flows
In the bilateral view, the tool offers to interrogate a pair of reporting countries by using a representation of their mirror flows. It’s one of the great strength of the RICardo database: a same bilateral flow is declared as an export by one of the countries and as an import by the other, however these two recordings are rarely the same (Dedinger and Girard, 2015). Thanks to the calculation of an indicator (Dedinger, 2012), the bilateral view offers an immediate view of the deviation between mirror flows and its fluctuations over the selected period.
6. A tool for researchers and students in social sciences
The exploratory formatting of data brings powerful tools to help research on the history of economics. It’s an excellent way to detect possible inconsistencies in data (Leclercq et al., 2013) in order to determine its cause. To achieve such a result, our method consisted in considering data visualizations as both results and media of research (Stefaner, 2010), in fostering collaboration between researchers, engineers and designers through workshops where each data visualization was discussed by articulating the methodological constraints of Economics and History, the ideas and principles of Design and technical workability.
Researchers have at their disposal an incomparable tool to deepen an analysis of trade statistics reliability (bilateral view), to compose monographs on the trade history of the world’s countries (country view), to study the history of trade globalization since the beginning of the 19 th century (world view) and to experiment data-driven teaching methods.
- Becker, R. A. and Cleveland, W. S. (1987). Brushing Scatterplots. Technometrics, 29(2): 127 doi:10.2307/1269768.
- Dedinger, B. (2012). The Franco-German trade puzzle: an analysis of the economic consequences of the Franco-Prussian war1: THE FRANCO-GERMAN TRADE PUZZLE. The Economic History Review, 65(3): 1029–54 doi:10.1111/j.1468-0289.2011.00604.x.
- Dedinger, B. and Girard, P. (2016). Visualizing trade globalization in the long run : the RICardo project. Working Paper Submitted to Historical Methods http://ricardo.medialab.Sciences-po.fr/Dedinger_Girard_RICardo_HistoricalMethods.pdf (accessed 26 February 2016).
- Latour, B., et al. (2012). ‘The whole is always smaller than its parts’ - a digital test of Gabriel Tardes’ monads. The British Journal of Sociology, 63(4): 590–615 doi:10.1111/j.1468-4446.2012.01428.x.
- Leclercq, C. and Girard, P. (2013). The Experiments in Art and Technology Datascape. Collections électroniques de l’INHA. Actes de Colloques et Livres En Ligne de l’Institut National D’histoire de L’art. INHA http://inha.revues.org/4926 (accessed 26 February 2016).
- Ricardo, D. (1817). On the Principles of Political Economy and Taxation. London: John Murray.
- Stefaner, M. (2010). Bootstrapping - use visualizations to create visualizations Paper presented at the VisualEyes / The Role of Design in Data, Information and Knowledge Visualization, Politecnico Milano, Italy http:// www. slideshare.net/MoritzStefaner/bootstrapping-use-visualizations-to-create-visualizations (accessed 26 February 2016).
- Tufte, E. (1990). Envisioning Information. Cheshire, CT, USA: Graphics Press.
- Tukey, J. W. (1977). Exploratory Data Analysis. Addison-Wesley Publishing Company.