Authors: Patricia Alkhoven, Ronald Stenvert, Sophie Elpers
Category: Paper:Long Paper
Keywords: visualisation, architectural floor plans, pattern recognition, floor plan analysis, digital architectural methods
Comparing Architectural Floor Plans: New Strategies New Digital Tools For Architectural Historians
Triggered by an article by Lev Manovich How to compare one million images? (Manovich, 2012: 249-78) we were intrigued to find out “how to compare and analyse thousands of architectural floor plans”? The reason for this interest was the availability of the archive of the Bureau Wederopbouw Boerderijen (Office for Farm Reconstruction, 1940-1955) with data of 7700 farmhouses that were destroyed during World War II and were subsequently rebuilt – reconstructed or redeveloped in a new form – between 1940 and 1955 (Elpers, 2008).
Since it seemed impossible to analyse almost 8000 drawings by hand we decided to study the possibility of automatic identification and categorization of these floor plans. For this paper, we explored several strategies and digital tools to find out more about their usefulness in art and architectural history in general to answer questions about change, distribution of spaces, typology, genre, etc.
1. Automation of architectural floor plans
By examining the differences between and changes of the floor plans of the reconstructed farms from the period between 1940 and 1955 and by comparing them with reconstruction sketches of the old destroyed farms, we hope to be able to answer questions such as: how was the struggle about tradition and modernization which determined the debate about farm construction in the middle of the twentieth century (Elpers, 2013) resolved in practice? This question focuses on the maintenance or abandoning of the so-called ‘streekeigen bouwen’ (traditional regional building)(Lambert, 2007) and related planning principles. Which traditional elements were retained and which were not? Which new elements were added? Can any general structural patterns be recognized?
For this aim we would like to be able to automatically categorize and recognize elements in the architectural drawings. Following the visualization method and software (ImagePlot) by Manovich we would also like to create clusters of images of farms ordered by morphological structure, type, architect, region and timelines as output.
As architectural historians with limited programming knowledge, we started looking for existing software to find answers. Search engines usually use databases with (meta)data about objects. In our case we would rather be able to study the drawings directly on its visual content. We hoped that a combination of image processing software, techniques for pattern recognition, OCR and vectorization would bring us closer to our goals. Following information about conventions of farmhouses e.g. specific rooms, and workspaces like sheds could be labelled and found. This method, that we use in our study, has been, amongst others, described by Hansson (1998).
2. Preprocessing
A test-set of about 1000 images was scanned in 300 dpi TIFF: 400 reconstruction drawings and 600 new floor plans. For each farm we have two sets of scans available: drawings of the old, destroyed farms and plans of the new farms. Further, we have built a repository with the TIFF-images in relation to a simple database.
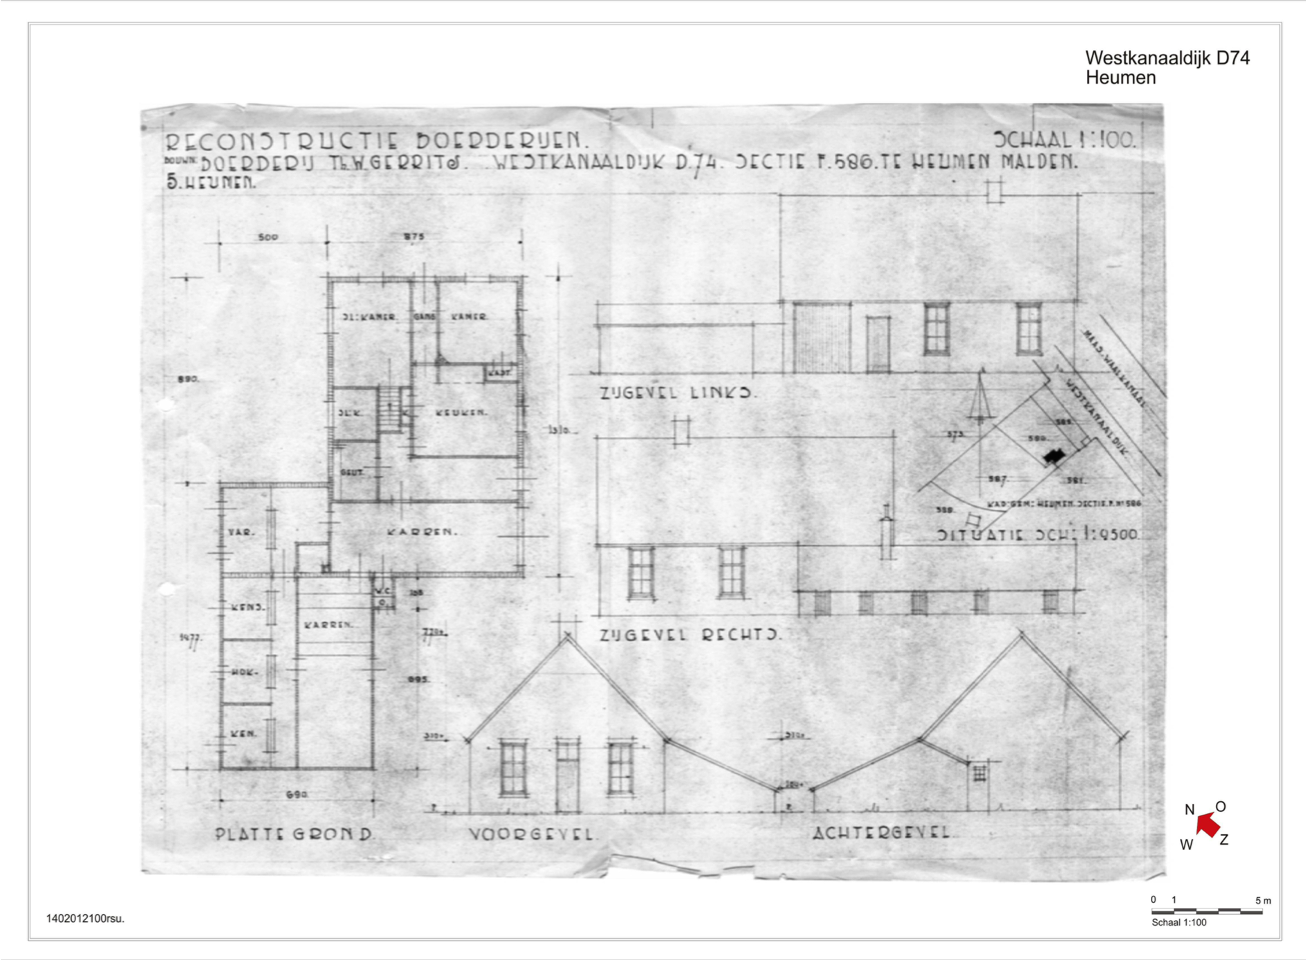
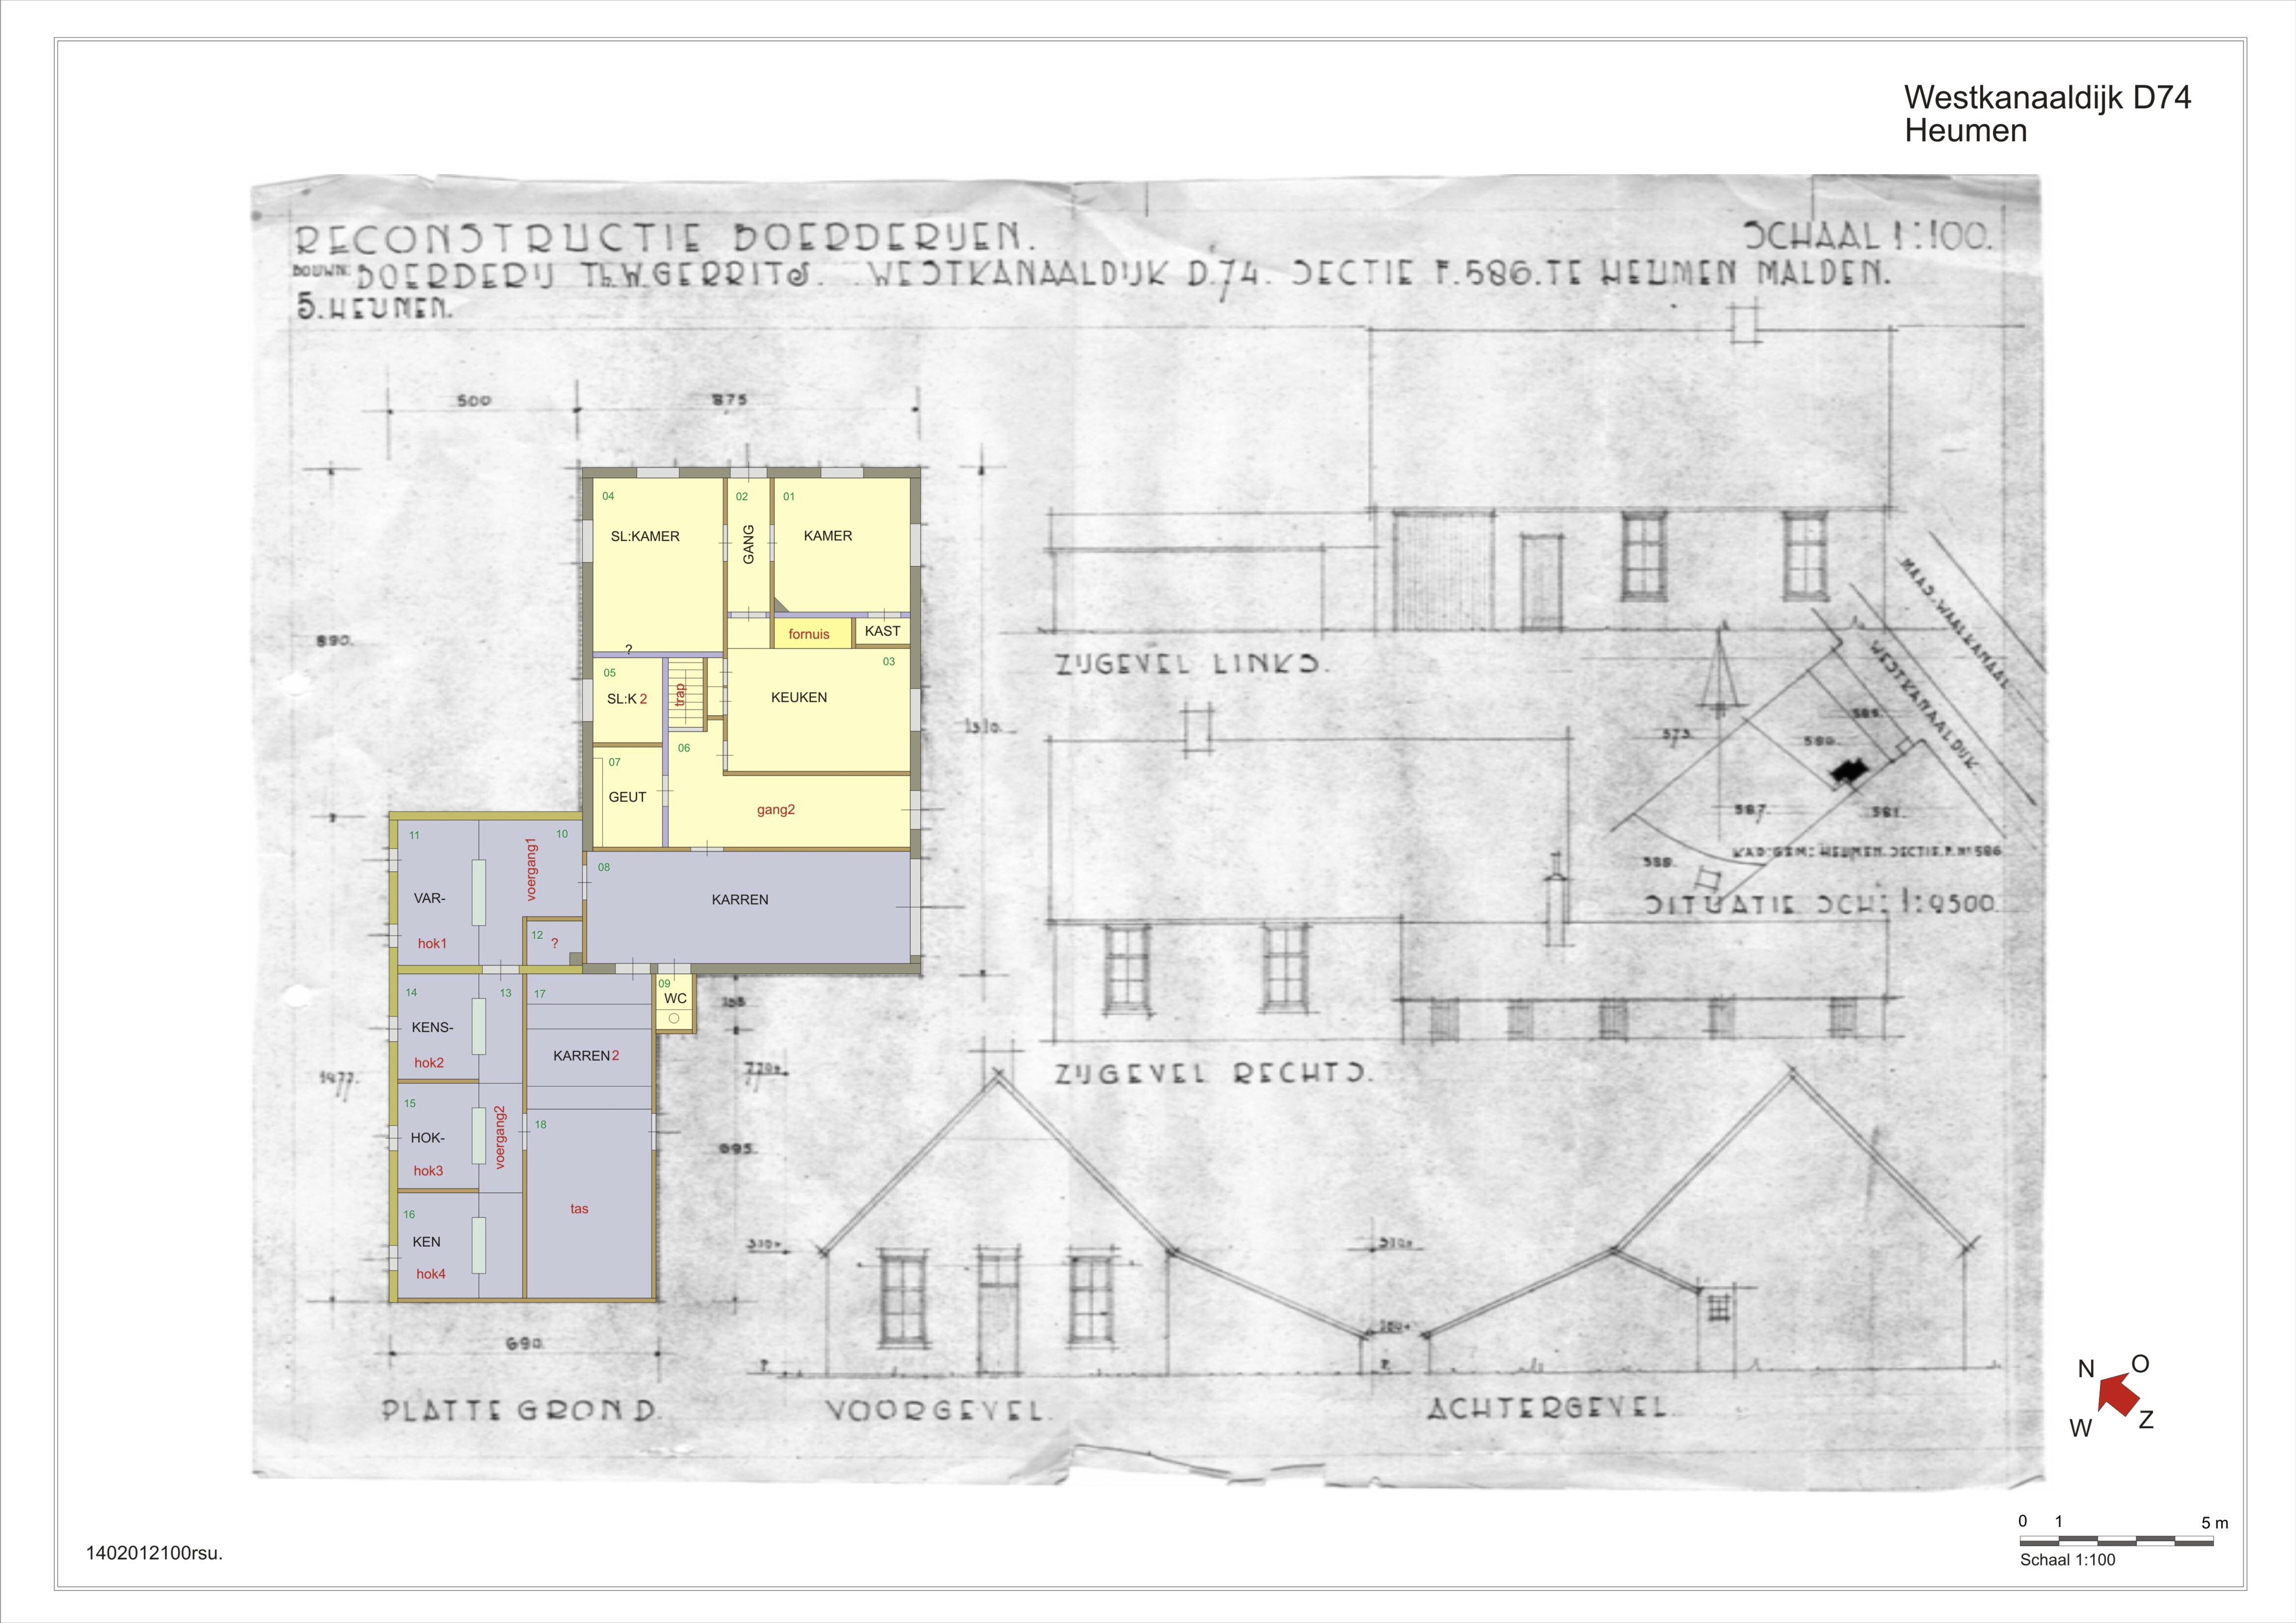
The architectural or engineering drawings show not just one floor plan of a farm but also plans of other floors, sheds and outbuildings, cross sections and several views, a drawing of the lay-out of the premises etc. Often several details are depicted, sometimes added in a separate drawing. Although the human eye can instantly distinguish which element is the main floor plan, one has to teach the computer how to find it. In order to isolate the floor plan from all the other parts of information, the white empty spaces surrounding the different elements in a drawing could be taken as a division space, separating the individual elements. First, we had to isolate the floor plan in the drawing and deconstruct its information. Unfortunately we could not find software that could ingest the drawings and produce the isolated floor plans, without programming. As a consequence, since it appeared too complicated to automatically find the position of the floor plan on the drawing, we skipped this part for the moment and prepared manually a new set of cut-out images of the floor plans.
With a simple image-processing program it appeared possible to manually deconstruct the contents of a drawing. In this way we could find out what steps were needed to automate the process. A drawing of Westkanaaldijk D74 in the village of Heumen (middle east of the Netherlands) was selected as a random example for the first test that shows the following manipulations:
- OCR-text
- Vectorize the floor plan
- Floor plan with text labels
- Walls (thick, medium, without openigs)
- Walls (thick, medium, with openings and numbers)
Although most techniques could be carried out with simple imaging software, such as CorelDraw – and we tried some other free online programs such as Inkscape, VectorMagic, Gimp, etc – the number of actions or manipulations just for one drawing appeared quite high. Although it works reasonably well for one drawing, this is exactly the process that we want to automate and connect with a search system.
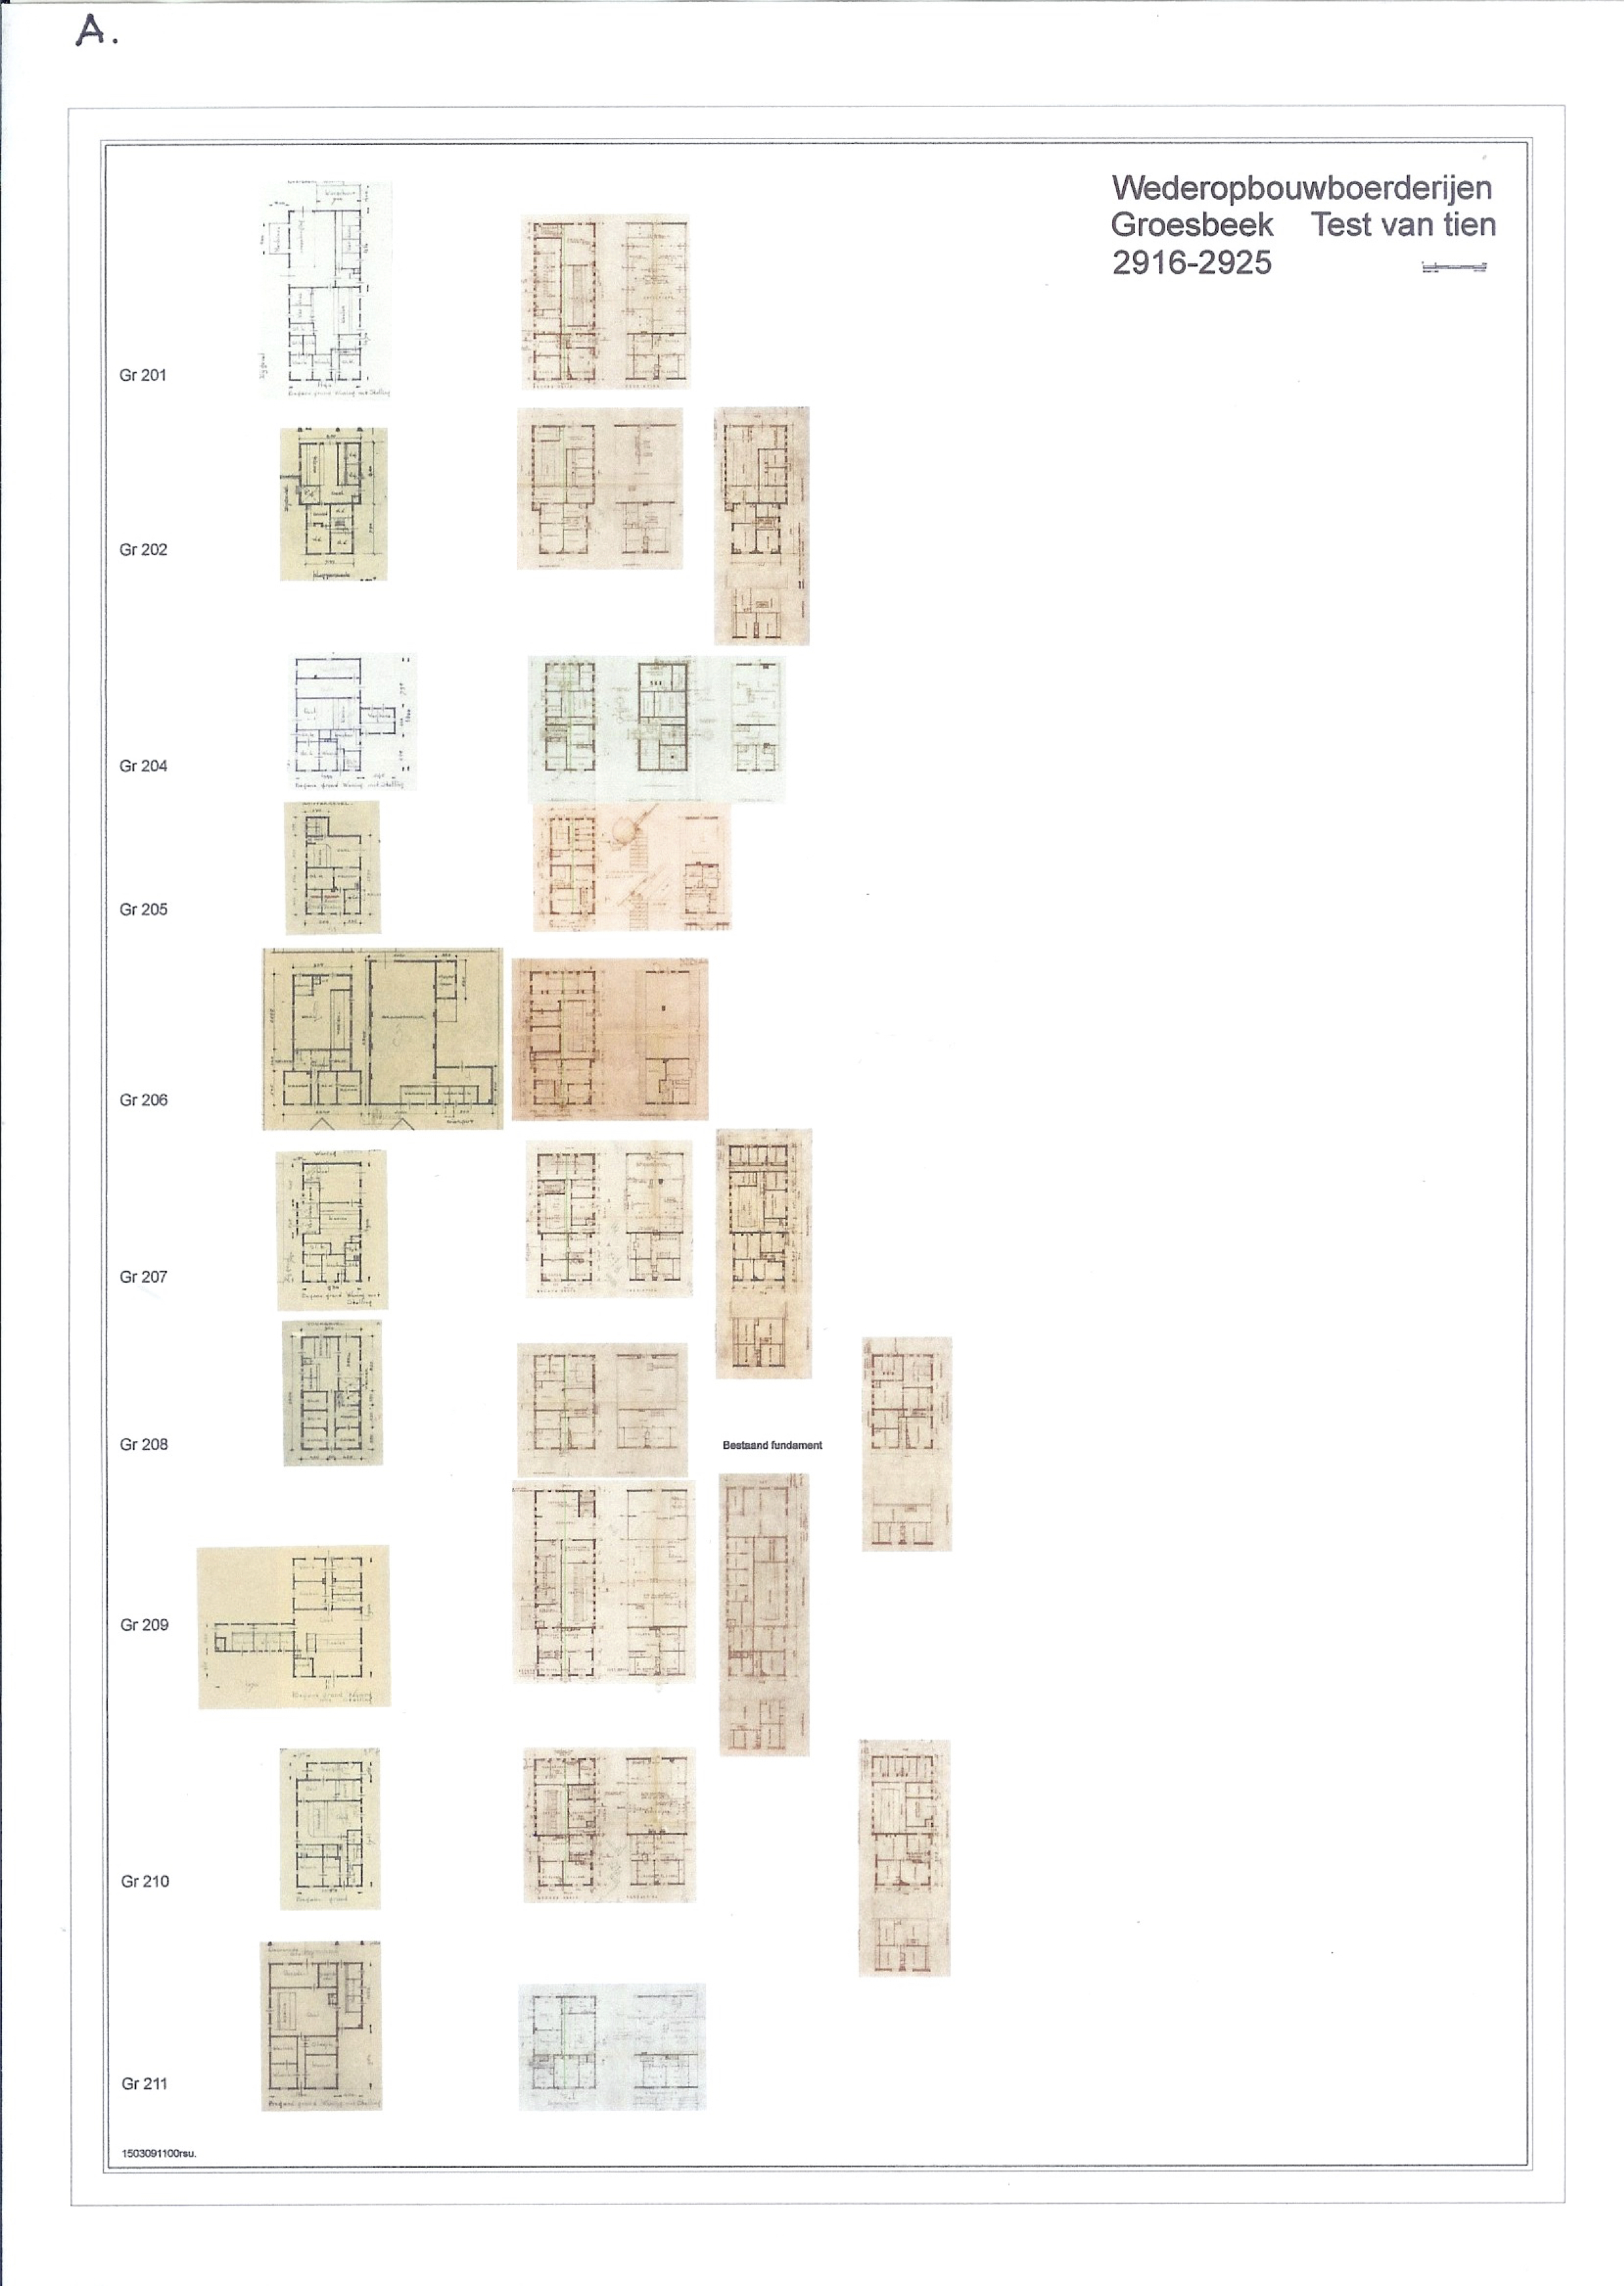
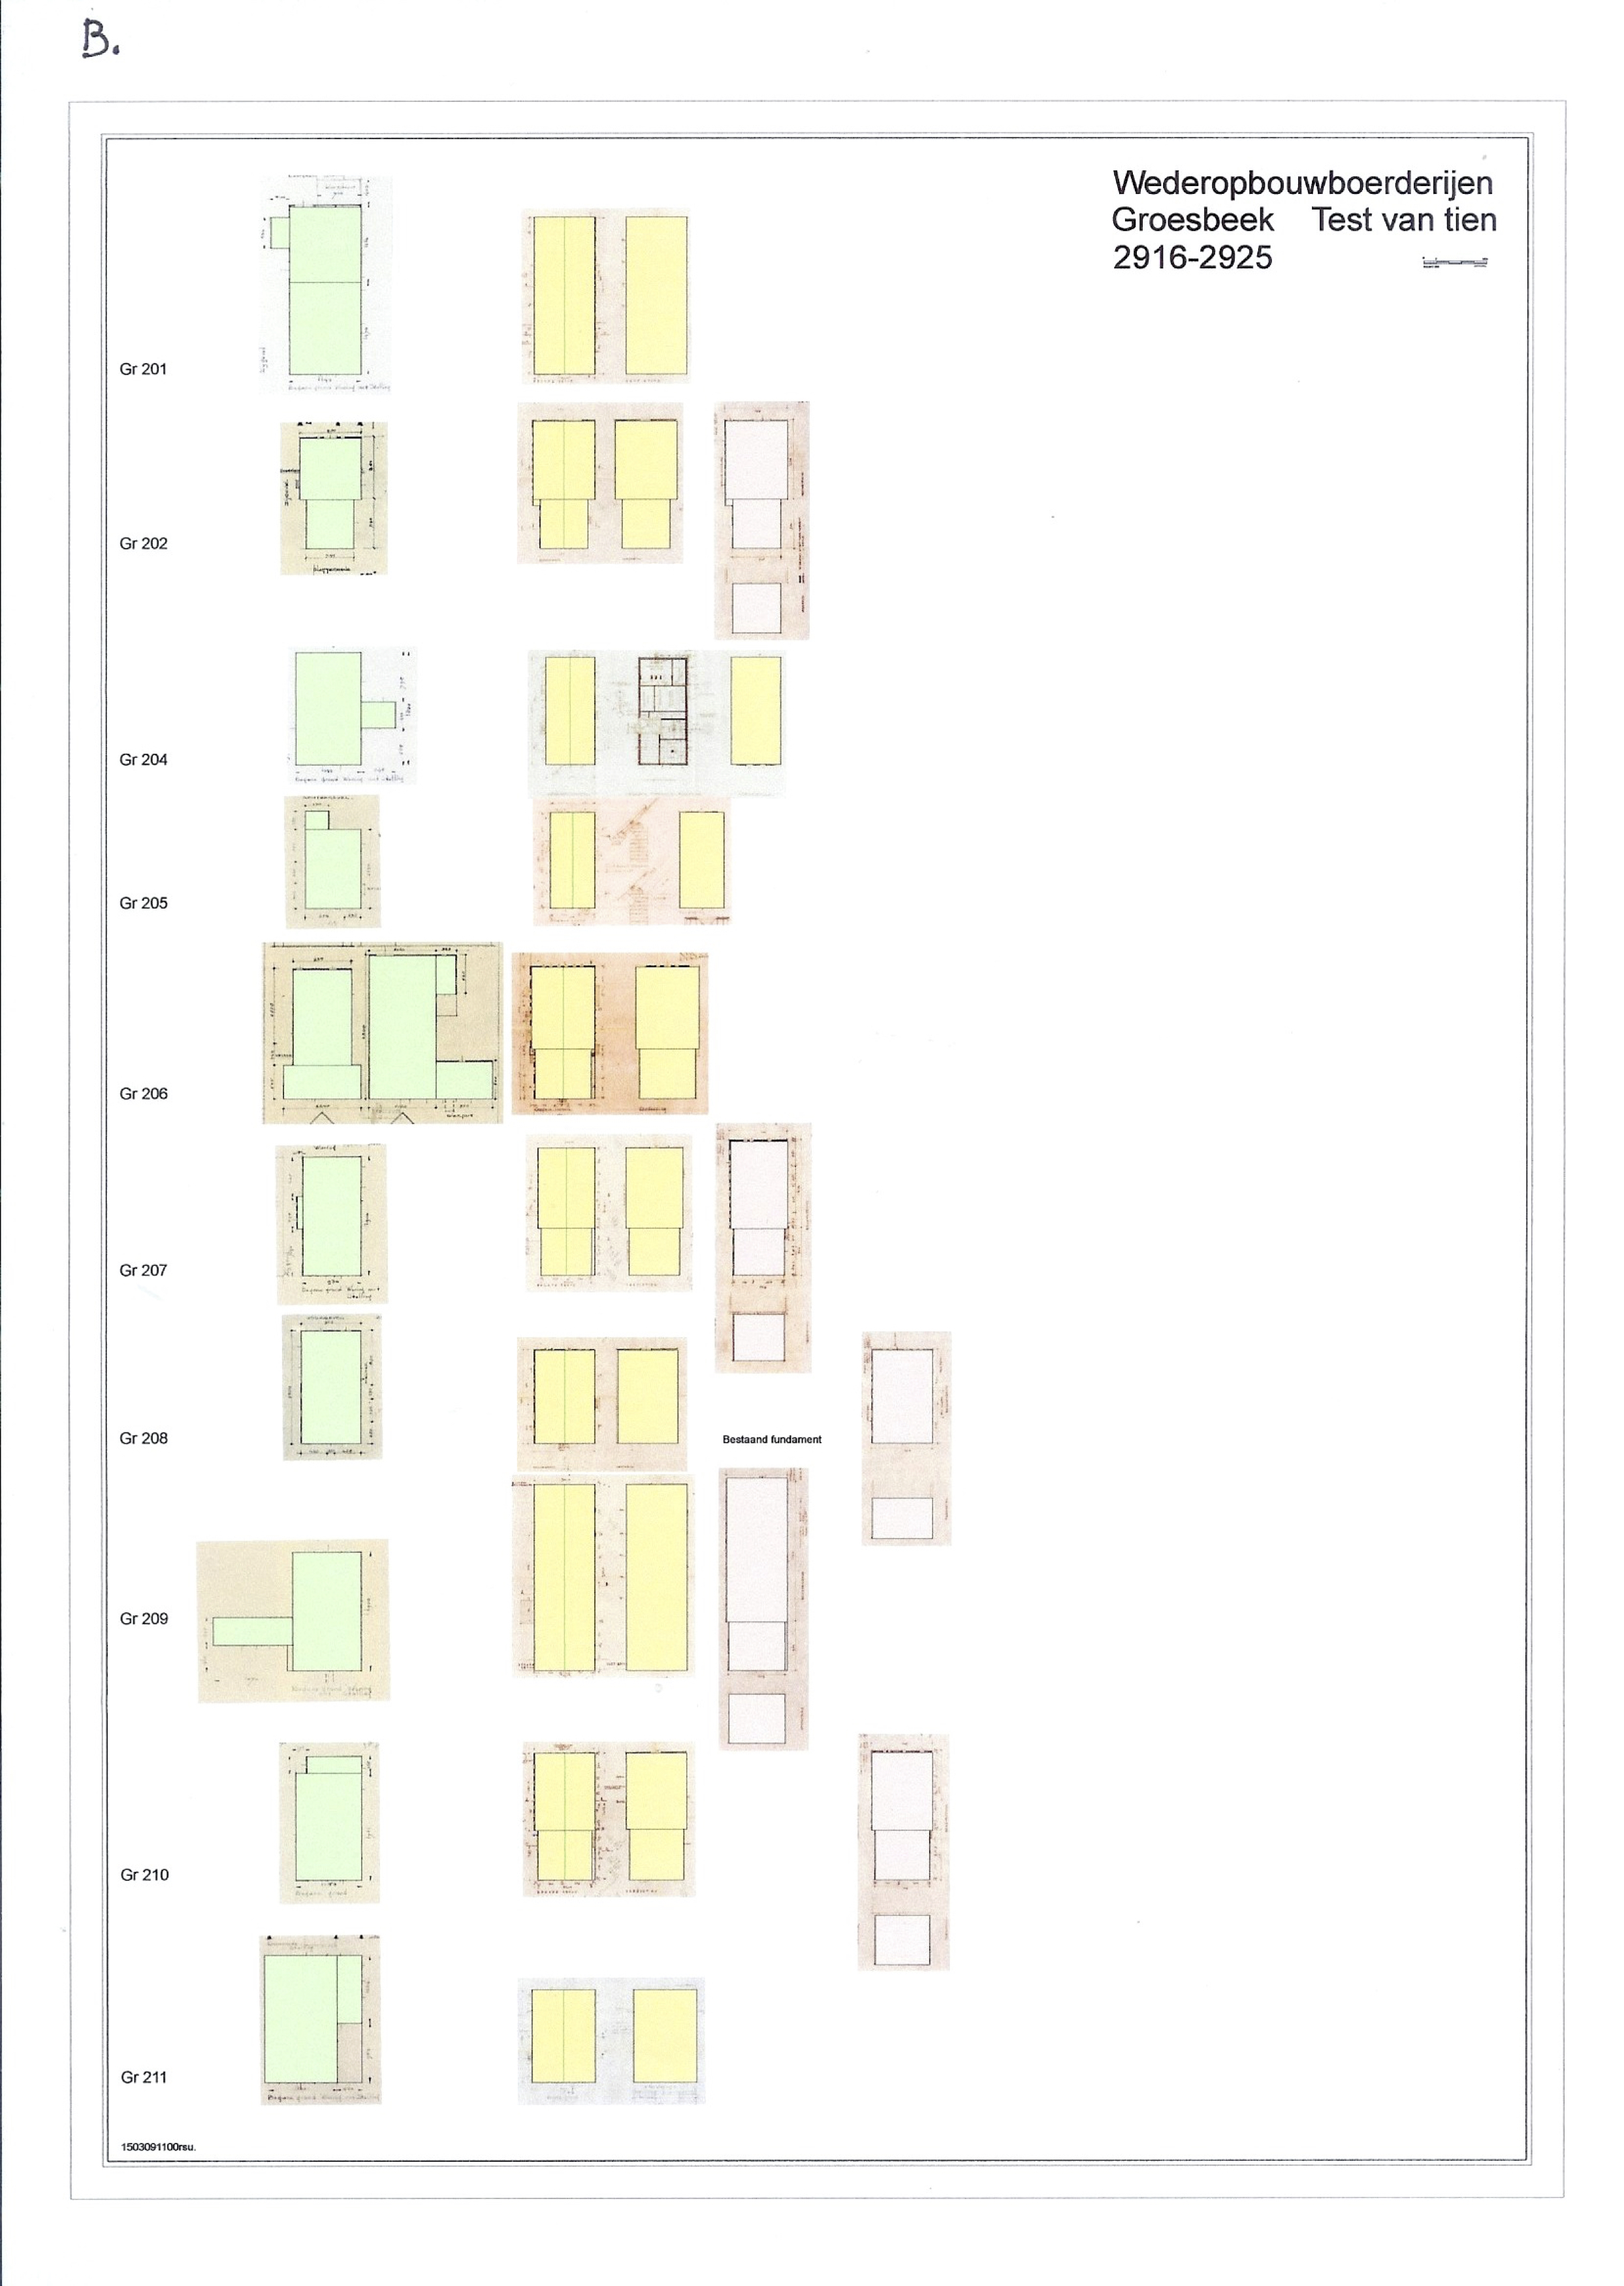
To scale up the process a bit, in a test with 10 floor plans of farms in the city of Groesbeek (middle east of the Netherlands) the following manipulations were carried out:
- the plan of ground floor and first floor were manually cut out
- images were converted from heavy tiff to the lighter jpg
- reconstruction drawings were converted from 1:200 to 1:100
- resolution of new plans were converted from 300 dpi to 150 dpi
- x/y axes were calibrated
- a central axis was determined
- it was noted that the drawings were not always on the right scale, while the inscribed measurements were noted correctly
- rooms are taken to be rectangles (which can be corrected later, but in most cases will not affect the results)
- the main spaces of farmhouses are accurate, while the interior spaces should be estimated on sight
It appeared that most walls have static measurements that can be brought into a library: the thickness of the walls depends very much on the type of bricks they are built with. These bricks have common measurements such as the Waalformaat (210 x 100 x 50 mm). The thickness of a wall therefore varies from 27 cm to 6 cm. The different sizes could then be coded by colour and compared.
3. Deconstructing drawings, isolating elements and detecting symbols
In order to deconstruct each drawing (see e.g.: Henderson, 2014; Dosch, 2000) the following steps were determined and carried out:
- Building a repository with images and database (same scale, direction)
- Finding the position of the floor plan on the drawing
- Determine (outlines of) spaces / rooms
- OCR all text information
- Recognizing walls (determining and labelling exterior and interior)
- Recognizing specific rooms (determining and labelling livingroom, kitchen, bathroom, hall, bedroom, stables etc.)
- Determining difference between reconstruction drawing (original state) and new plan and difference between reconstruction drawings from different years
To carry out the recognition part such as wall detection, text recognition and labelling, and making comparisons of old and new, the approach of Ahmed and Liwicki (Ahmed et al. (2011; 2014) appears promising for solving some of our problems. Although they focus on using sketches to be recognized and compared with floor plan drawings in a repository, we would like to see how their system works for us with our repository of cut-out floor plans.
Timelines can relatively easy be visualized using the metadata - with the tag “year” - in the database example (Borner, 2010; Alkhoven, 1998; 2008). Other tests with visualization software such as ImagePlot produced interesting and beautiful views of the drawings but could not yet provide the required results for analysis. More experimentation and possible adaptation of the software is needed.
4. Next steps
We set out to find answers on how we could compare thousands of drawings of floor plans, what digital tools and best practices are currently available to analyse them and how we could visualize differences in sets of floor plans. In this first stage of the process we have gathered information about the preprocessing stages and we were able to perform some experiments with the scanned architectural drawings.
We discovered many – free–tools but it turned out difficult to distinguish among them and to choose the best ones that could solve each part of the problem. We have tested several apps but since it was not our objective to deal with coding, we could not adapt the software and we were therefore limited in doing our research. As a consequence much had to be done manually in a computer-assisted way.
Since our overall problem appeared a bit too ambitious to carry out within the given boundaries of time and budget, we have limited ourselves to producing a list of ingredients and a well-argumented recipe formulating the next sequence of steps to take. These form the basis for a new research proposal for the Digital Humanities’ call in The Netherlands. A long article with more detailed information about the process, experiments, and results, will be ready later this year.
- Ahmed, S. et al. (2011). Improved automatic analysis of architectural floor plans. Document Analysis and Recognition (ICDAR), pp. 864-68.
- Ahmed, S. et al. (2014). Automatic Analysis and Sketch-based Retrieval of Architectural Floor Plans, Pattern Recognition Letter, 35, pp. 91-100.
- Alkhoven, P. (1993). The Changing Image of the City. A Study of the Transformation of the Townscape by means of Computer-Aided-Architectural-Design and Visualization Techniques. A case study: Heusden. Alphen aan den Rijn.
- Alkhoven, P. (1998). Computer Visualisation as a tool in Architectural Historical Research. Architectural and Urban Simulation Techniques in Research and Education, Delft University Press, pp. 16-23.
- Berry, D. (2012). Understanding Digital Humanities, Palgrave: Macmillan.
- Börner, K. (2012). Atlas of Science. Visualizing what we know.
- Dosch, Ph. et al. (2000). A complete system for the analysis of architectural drawings. International Journal on Document Analysis and Recognition, vol.3: 102-16.
- Elpers, S. (2008). Het archief van het Bureau Wederopbouw Boerderijen, Vitruvius. 1(3): 40-47.
- Elpers, S. (2013). Erfenis van het verlies. De strijd om de wederopbouw van boerderijen tijdens en na de Tweede Wereldoorlog (unpublished PhD thesis) Amsterdam: University of Amsterdam).
- Hanson, J. (1998). Decoding Homes and Houses, Cambridge.
- Henderson, T.C. (2014). Analysis of Engineering Drawings and Raster Map Images.
- Lamberts, B. (2007). Boerderijen. Categoriaal onderzoek wederopbouw 1940-1965. Zeist.
- Manovich, L. (2012). How to compare one million images? Understanding Digital Humanities, pp. 249-78.