Authors: Lars Wieneke, Marten Düring, Daniele Guido
Category: Paper:Long Paper
Keywords: crowdsourcing, co-occurrences, graph-based exploration, cultural heritage
Introducing HistoGraph 2: Exploration of Cultural Heritage Documents Based on Co-Occurrence Graphs
In this paper we discuss our strategy for the creation and exploration of graphs based on co-occurrences of named entities using the recently developed open source version of histograph and present a live demo. histograph builds on previous work conducted in cooperation with several European partners in the FP7 funded project CUbRIK but has been further developed by the Centre Virtuel de la Connaissance sur l’Europe (CVCE) in 2015. It combines the graph-based exploration of large cultural heritage collections with crowd-based indexation. histograph opens up a new perspective on CVCE’s collections which contain some 20.000 digitized text documents, photos, audio recordings and videos that document the history of European integration since 1945.

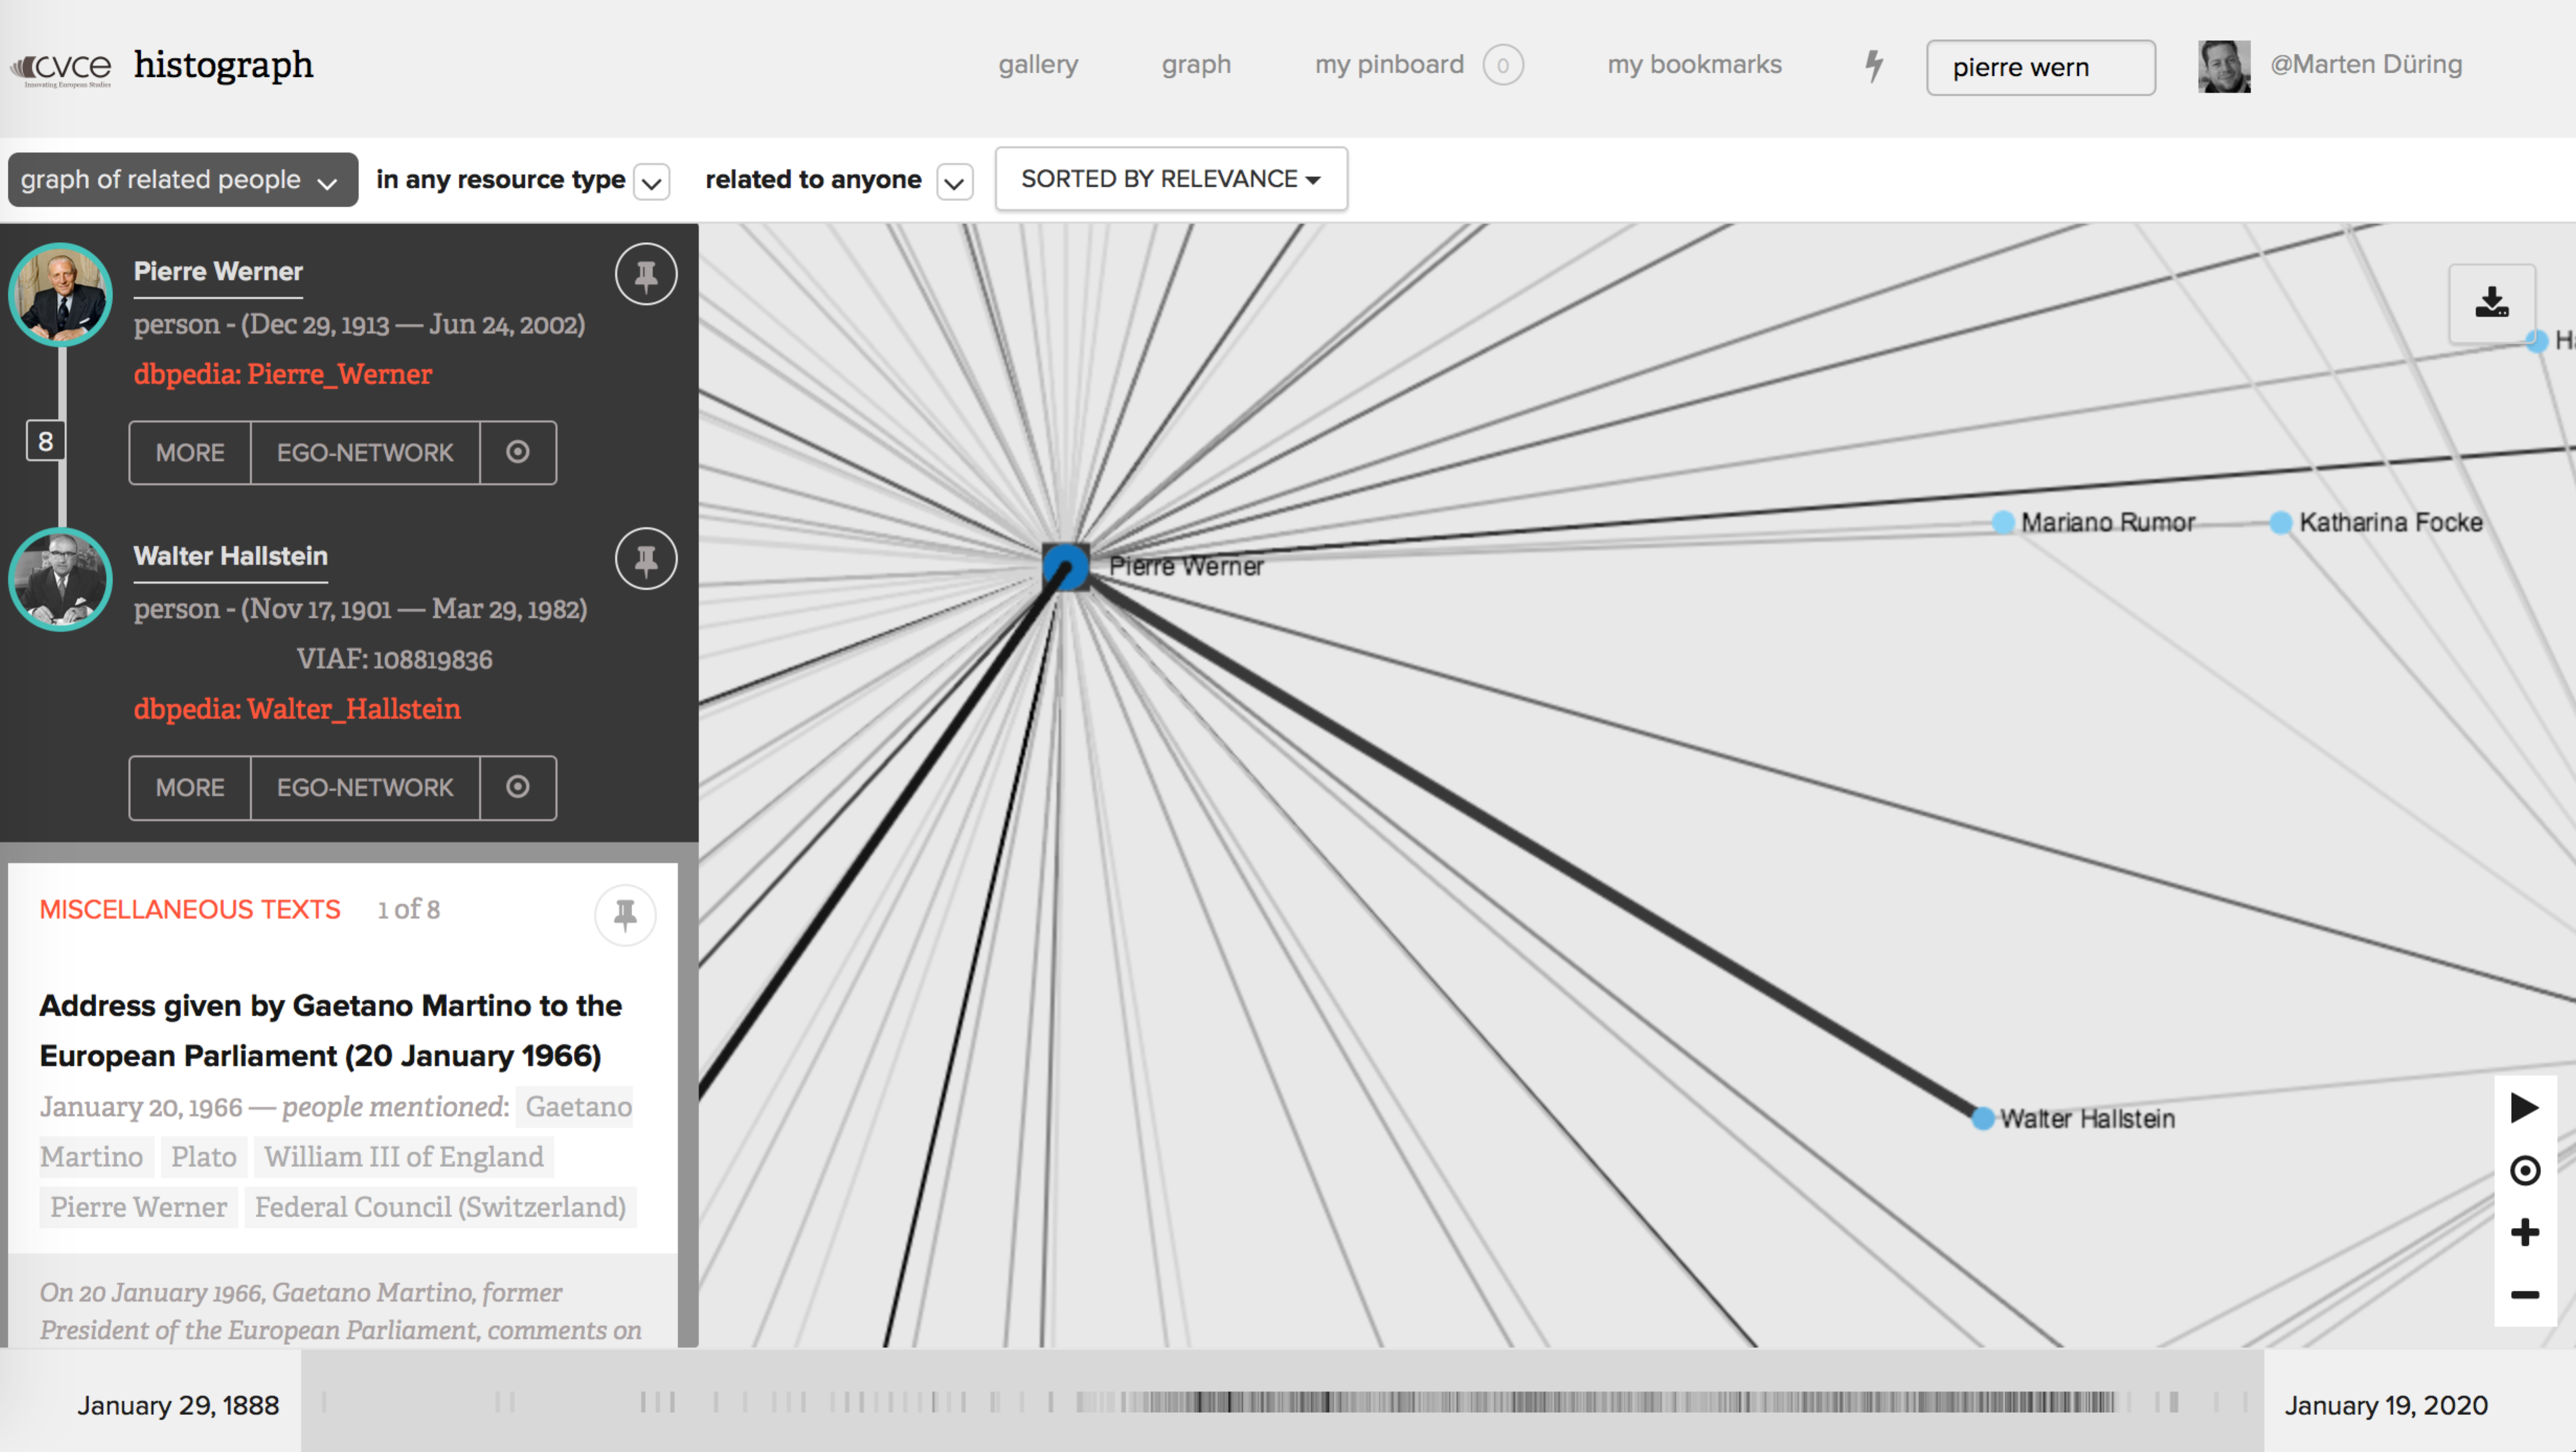
histograph adds an explorative approach to the hierarchically organized, expert-curated collections of CVCE.eu: Users decide what interests them and find their own path through the collections. A user who is interested in Pierre Werner will for example see a page similar to the screenshot below.

The left column provides an overview of Pierre Werner’s biography and a list of persons with whom he co-occurs in the document base. The middle column lists all documents in which he is mentioned. The graph view provides a bird’s-eye-perspective on the people who co-occur with Werner. The graph is interactive and reveals the documents which constitute a co-occurrence relationship.
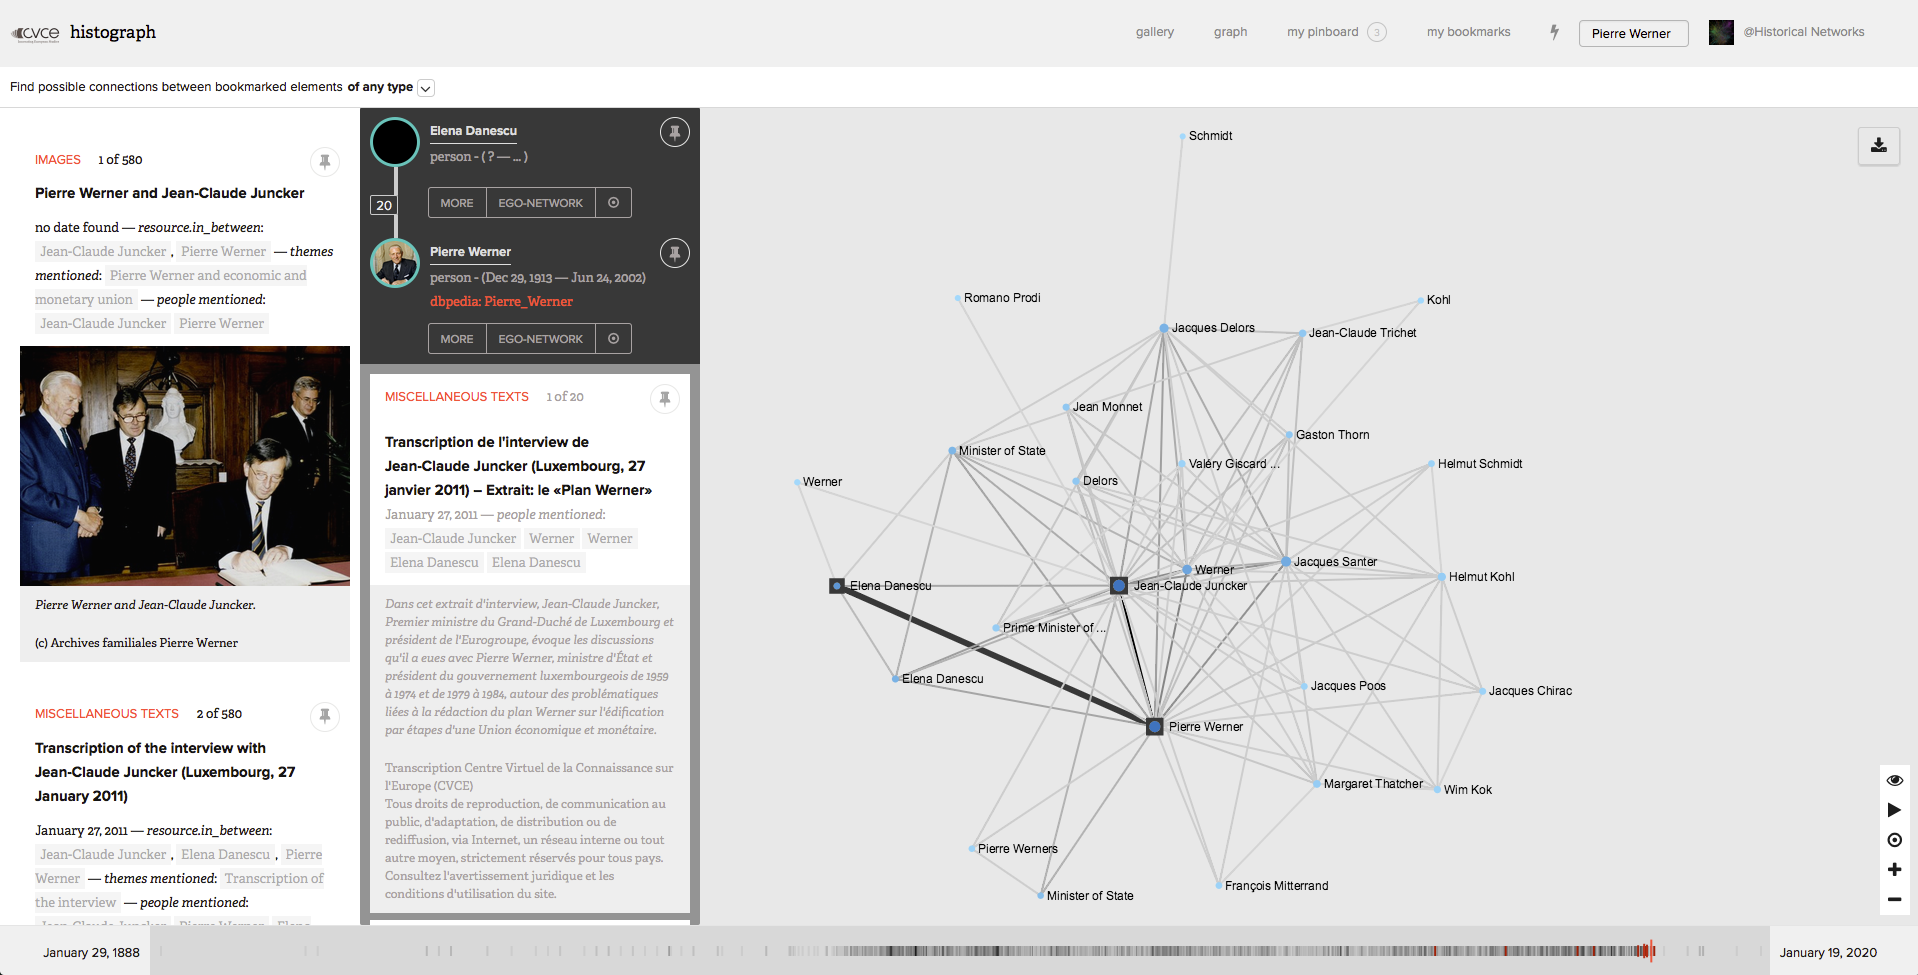
histograph uses a Neo4j (Neo4j Console, 2016) graph database to store relations between entities. This approach facilitates queries that would be computationally expensive in relational databases but are easily available in graph databases, such as the calculation of paths between entities that are not directly connected. Figure 4 shows the result of a query for all documents, which connect three persons.
In contrast to the hierarchical, expert-curated collections, histograph enables an interest driven exploration by the users and provides them with an effective way to retrieve and explore the relations which are of interest to them. Compared with the museum-like order of the classical CVCE collections, histograph models a more or less targeted visit to an archive, which holds the promise of serendipitous discoveries.
Methods for the annotation of named entities such as persons, institutions and places have reached a very high degree of maturity and are used in different applications. For histograph we tested a variety of web services for the detection and disambiguation of entities (NER) among them TextRazor (TextRazor - The Natural Language Processing API, n.d.) and YAGO (Max-Planck-Institut für Informatik: YAGO, 2016). While these services perform well depending on the context of use (language, domain, etc.) even in a best case scenario they only allow to identify the occurrence of an entity within a logical unit such as a text but do not allow to clarify the nature of the connection between persons, places and organisations that occur together in the same unit. In our previous experiences with the detection and identification of faces in historical image sets (Wieneke et al., 2014) the format and context of the images as official photographs of specific events enabled us to understand the nature of the relationship as more easily defined: the simple working hypothesis that persons that co-occur together in a photo have some kind of connection proved to be very efficient. In the case of text however, these semantics are significantly more complex.
We therefore decided to follow two directions: first based on the nature of the text document, where letters for example constitute a relationship between the sender and the receiver and second through a mathematical modelling of the relationship based on the distance between entities in the text and their distribution within the corpus. More specifically, we work with Jaccard distances and co-occurrence frequencies weighed by tf-idf specificity. The latter step became necessary as not all of our text documents fall in the category of clearly structured formats such as letters and even if they do, a strictly format based co-occurrence approach could hide interesting relationships that would foster exploration, e.g. in our case a written exchange between two politicians where they discuss a third person.
Entities who appear within a certain distance from each other can be linked based on the assumption that their co-occurrence in the text is not arbitrary and that there is a high probability that they have something to do with each other. The boundaries for such relations can be defined freely, for example based on sentences, paragraphs, or documents. Alternatively, a window approach considers all entities related if they appear within n characters from each other. In addition, such co-occurrences can be further defined by the recognition of the semantic relationships within a sentence. We have, however, not yet systematically tested their performance and therefore limit ourselves here to a more basic approach.
Despite all efforts to further specify the significance of such relations, co-occurrences are elusive:
- It is hard to further specify what more or less connected mean
- It is hard to further specify which types of relations are at play
- It is hard to assess which relations were missed because entities were named differently
A graph representation of such data can only allow rather general statements: We can reasonably assume that entities, which co-occur often, are more connected than those who do not. We can also assume that entities, which never co-occur together, are less or not at all connected. Finally, we can assume that entities, which tend to cluster together, are more likely to have something to do with each other without further specifying their relationship.
In contrast, most social network analysis (SNA) research questions require very well defined relations given that they treat social networks as models of highly complex social interactions. Here, a graph represents a meaningful reduction of such complexity and allow insights into specific dimensions of social relations. Graphs are used to represent and/or illustrate highly complex matters, which are otherwise hard to express. Such data is typically generated and curated for the purpose of specific research questions and its value is limited to their respective context in which it was created.
CVCE and cultural heritage institutions in general however address heterogeneous user groups and wish to make available their data to different audiences including educators, researchers and interested laymen. A graph representation of relations between entities therefore will serve different purposes than in a SNA context. Here, graphs need not be meaningful models of social relations but need to be multi-purpose means for the discovery of materials and acknowledge wildly different interests. This means that it is impossible to predict, which relations a user will consider relevant.
Against this background we embrace co-occurrences despite their inherent shortcomings. In order to improve the quality of the various relations we display we need to balance a) higher quality or more meaningful relations and b) the potential to make highly unexpected, yet meaningful discoveries in the data. In order to achieve this, we decided against a rigid ontology of relationship types, which would significantly limit the chances for unexpected discoveries, beyond format based assumptions. Instead we use text synopses and full document text for the generation of relations and filters on time periods, media types and entities in order to further specify our graphs. In addition, we use a two-fold crowd-based approach: generic crowds help clean the data and report obvious mistakes; expert crowds provide high-quality annotations which required a highly domain-specific knowledge. Generic crowds perform tasks which do not require specialist knowledge, for example an answer to the question “Is ‘N.A.T.O.’ a person?” Expert crowds are identified based on past performance and are presented with tasks related to entities and documents they have worked on before.
The resulting graphs can be considered hybrids: They are inasmuch based on co-occurrences as they are on user specifications. Such graphs, we argue, have the potential to meet both the necessities for the automated generation of graphs and still provide meaningful structural information which can be the starting point for a deeper investigation of the materials. We are committed to further increase the quality of co-occurrence relationships in the future.
- Max-Planck-Institut für Informatik: YAGO (2011). https://www.mpi-inf.mpg.de/departments/databases-and-information-systems/research/yago-naga/yago/ (accessed 3.01.2016).
- Neo4j Console (2016). http://console.neo4j.org/ (accessed 2.06.2015).
- TextRazor - The Natural Language Processing API (n.d.). https://www.textrazor.com/ (accessed 20.04.2015)
- Wieneke, L., Düring, M., Silaume, G., Lallemand, C., Croce, V., Lazzarro, M., Nucci, F., Pasini, C., Fraternali, P., Tagliasacchi, M., Melenhorst, M., Novak, J., Micheel, I., Harloff, E., Garcia Moron, J. (2014). histoGraph – A Visualization Tool for Collaborative Analysis of Historical Social Networks from Multimedia Collections. In L. Hughes (Ed.), Proceedings of 18th International Conference Information Visualisation (IV), 2014 Conference. Paris, France.