Authors: Stefan Evert, Fotis Jannidis, Thomas Proisl, Thorsten Vitt, Christof Schöch, Steffen Pielström, Isabella Reger
Category: Paper:Long Paper
Keywords: Delta, distance measures, normalization
Outliers or Key Profiles? Understanding Distance Measures for Authorship Attribution
1. The state of the art
Burrows’ Delta is one of the most successful algorithms in computational stylistics (Burrows 2002). A series of studies have proven its usefulness (e.g. Hoover 2004, Rybicki & Eder 2011). There are two essential steps in Burrows’ Delta. The first is to standardize the relative frequencies of words in a document-term-matrix through a z-score transformation. In the second step, the distances between all texts are calculated. For each word, the difference between the z-score of the word in one and the other text are calculated. The absolute values of the differences are added for all words taken into account. The usual interpretation is that the smaller the sum, the more similar two texts are stylistically, and the more likely it is that they have been written by the same author.
Despite the fact that Burrows’ Delta is as simple as it is useful, there is still a lack of a good explanation why the algorithm works so well. Argamon (2002) has shown that the second step in Burrows’ Delta is equivalent to taking the Manhattan distance between two points in a multi-dimensional space. He suggests, among other things, using the Euclidean distance instead. An empirical test of his proposals has shown, however, that none of them lead to an improvement in performance (Jannidis et al. 2015).
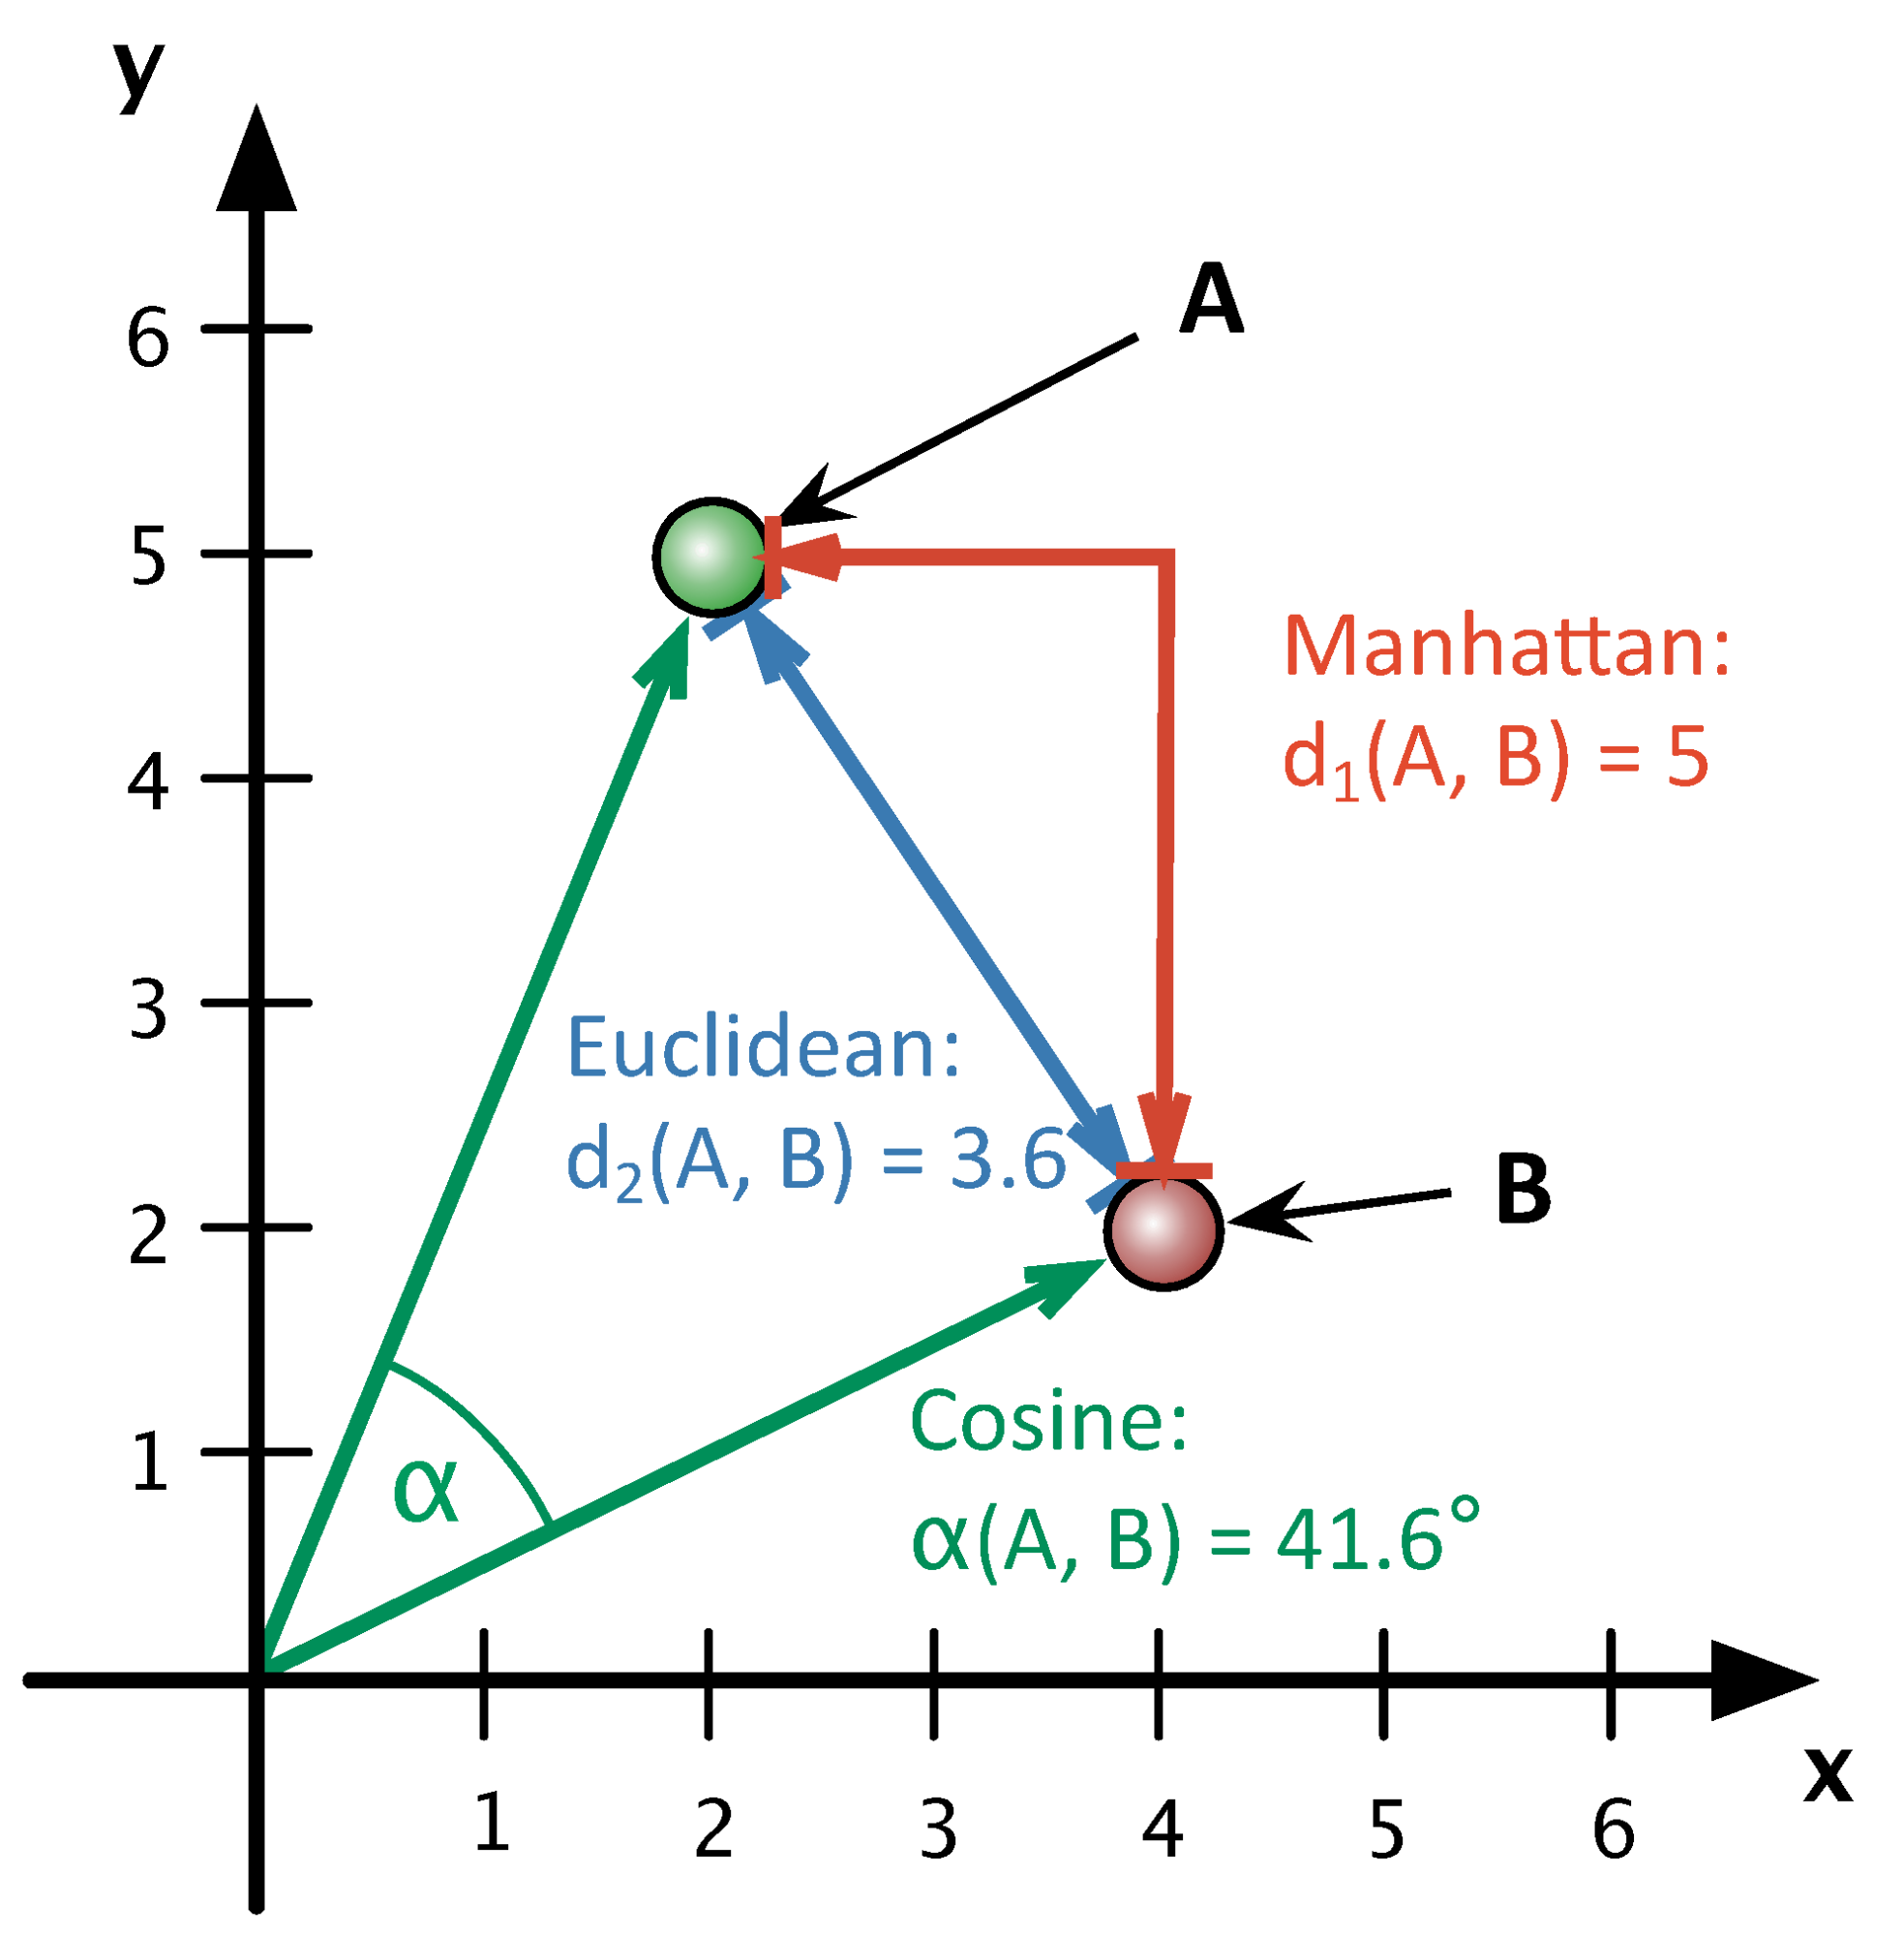
Smith and Aldrige (2011) have suggested to use the cosine of the angle between the document vectors for the second step, as is customary in Information Retrieval (Baeza-Yates & Ribeiro-Neto 1999:27). The Cosine variant of Delta (Delta Cos) outperforms Burrows’ Delta (Delta Bur) in many different settings and has the advantage of not showing the drop in performance typical ofother Delta variants when large numbers of MFW are used (Jannidis et al. 2015). The question now is why Delta Cos is so much better than Delta Bur and other variants, that is, in what way Delta Cos captures the authorship signal more clearly than other variants of Delta.
Of decisive importance for our further analyses was the insight that using the Cosine Distance is equivalent to a vector normalization in the sense that (in contrast to Manhattan and Euclidean Distance) the length of the vector does not play a role for the calculation of the distance (see figure 1). Previous experiments have shown that an explicit, additional vector normalization also substantially improves performance of the other Delta measures (Evert et al. 2015).
2. Hypotheses
Having discovered that impact of the normalization effect, we have developed two empirically testable hypotheses:
- (H1) Performance differences are caused by single extreme values, so-called outliers. These are particularly large positive or negative z-scores specific to single texts rather than all texts of a single author. As the Euclidean distance should be more sensitive to single extreme values than the Manhattan distance, this hypothesis would explain the comparatively bad performance of Argamon’s “Quadratic Delta” Delta Q. The positive effect of vector normalization originates from the reduction of outlier amplitudes (“outlier hypothesis”).
- (H2) The author specific “style profile” manifests itself more in the qualitative combination of word preferences, i.e. in the pattern of over- and under utilization of vocabulary, rather than in the actual amplitude of z-scores. A text distance measure is particularly successful in authorship attribution if emphasizing structural differences of author style profiles without being too much influenced by actual amplitudes (“key-profile hypothesis”). This hypothesis explains directly why vector normalization results in such impressive improvements: it standardizes the amplitudes of author profiles in different texts.
3. New insights
3.1. Corpora
For the experiments in this paper, we use three similarly composed corpora in German, English and French. Each corpus contains 25 different authors with 3 novels each, thus 75 texts in total. The corpora have been described in Jannidis et al. (2015). Due to space issues, the following section will only present our observations on the German corpus. The results for the corpora in both other languages show only small deviations and also support our findings.
3.2. Experiments
To further investigate the role of outliers and thus the plausibility of H1, we complement Delta Bur and Delta Q with additional variants based on the general Minkowski distance (for p ≥ 1):

We generally name these distance measures L p-Delta. The specific case p = 1 equals the Manhattan distance (L 1-Delta = Delta Bur), p = 2 the Euclidean distance (L 2-Delta = Delta Q). The higher the value for p, the larger the influence of single outliers on L p-Delta.
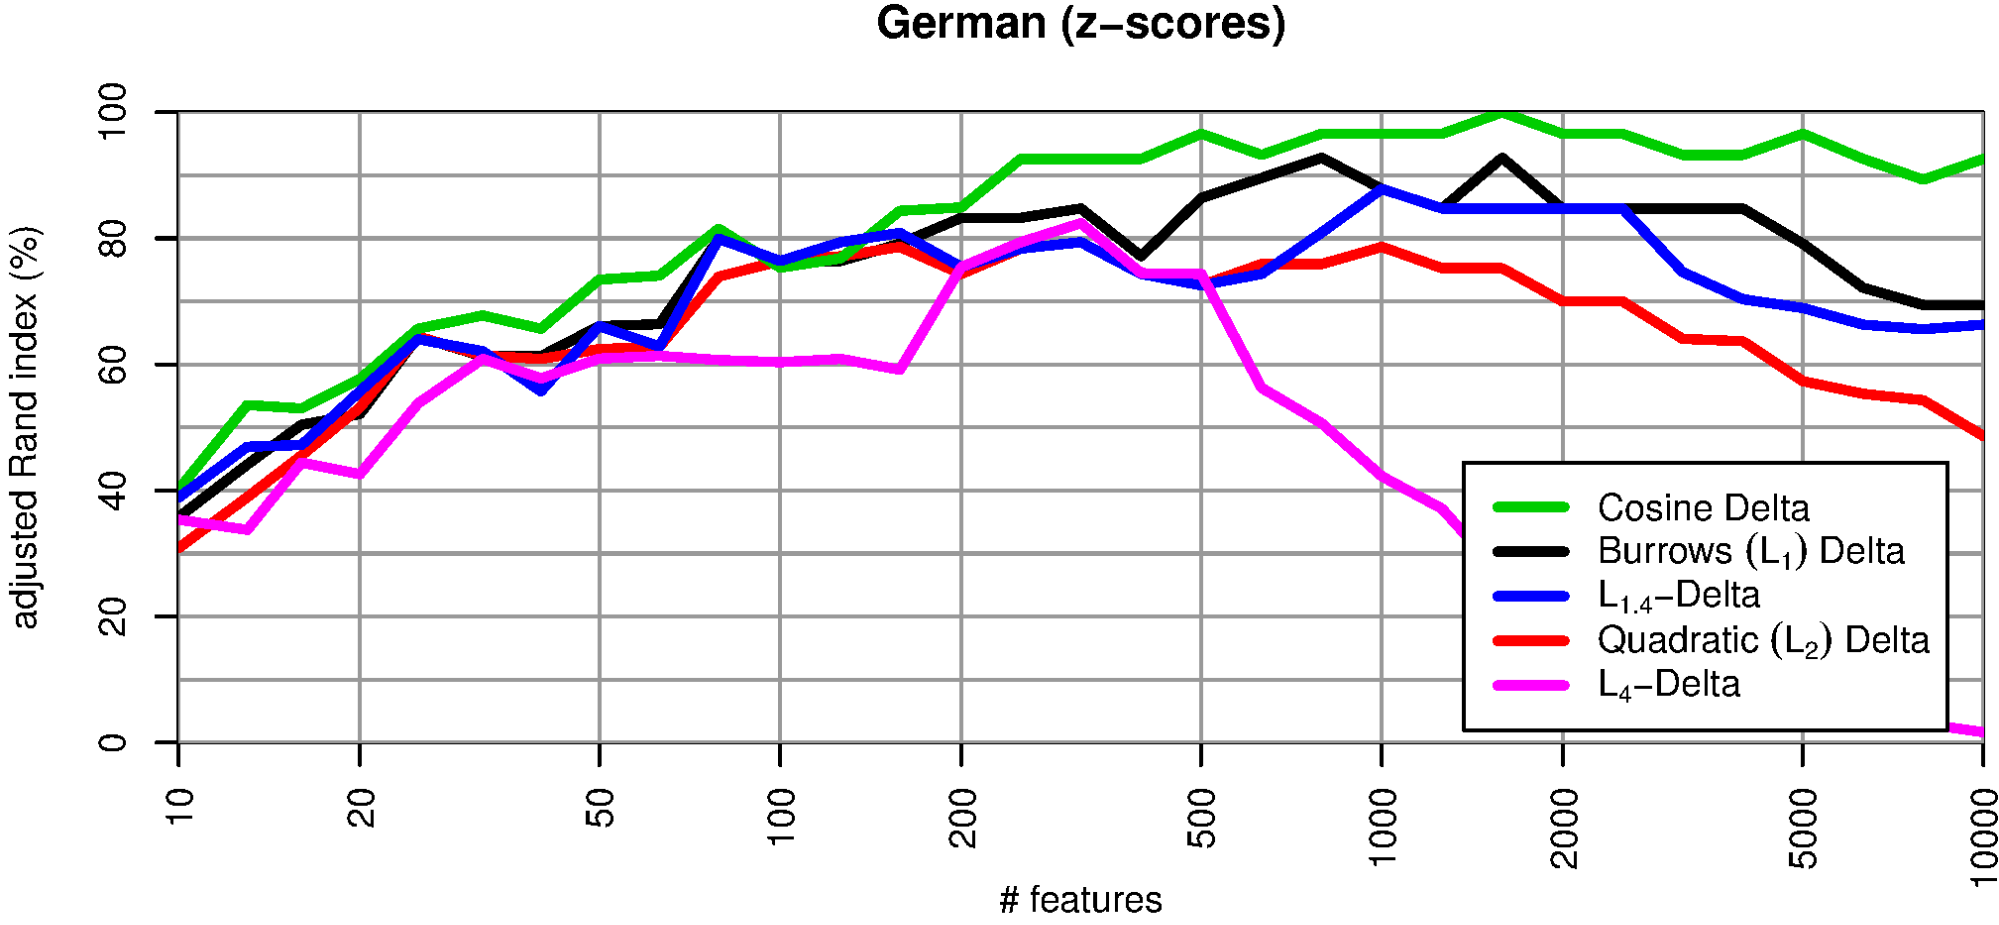
Fig. 2 compares four different L p distance measures (for p=1, √2, 2, 4) with Delta Cos. The method of comparison is the same as in Evert et al. (2015): 75 text are automatically clustered in 25 groups according to Delta distances; clustering quality is estimated with the adjusted rand index (ARI). An ARI of 100% signifies perfect author recognition whereas a value of 0% shows that the clustering is entirely random. The performance of L p Delta obviously decreases with increasing p. Additionally, the robustness of the measures also decreases with an increasing number of MWF used. As already reported in Jannidis et al. (2015) and Evert et al. (2015), Delta Bur (L 1) consistently outperforms Argamon’s Delta Q (L 2). Especially if many features, i.e. a large number of MFW is considered, high p values result in low performance. Delta Cos is more robust than other variants and achieves almost perfect attribution success (ARI > 90%) over a wide range of the MFW.
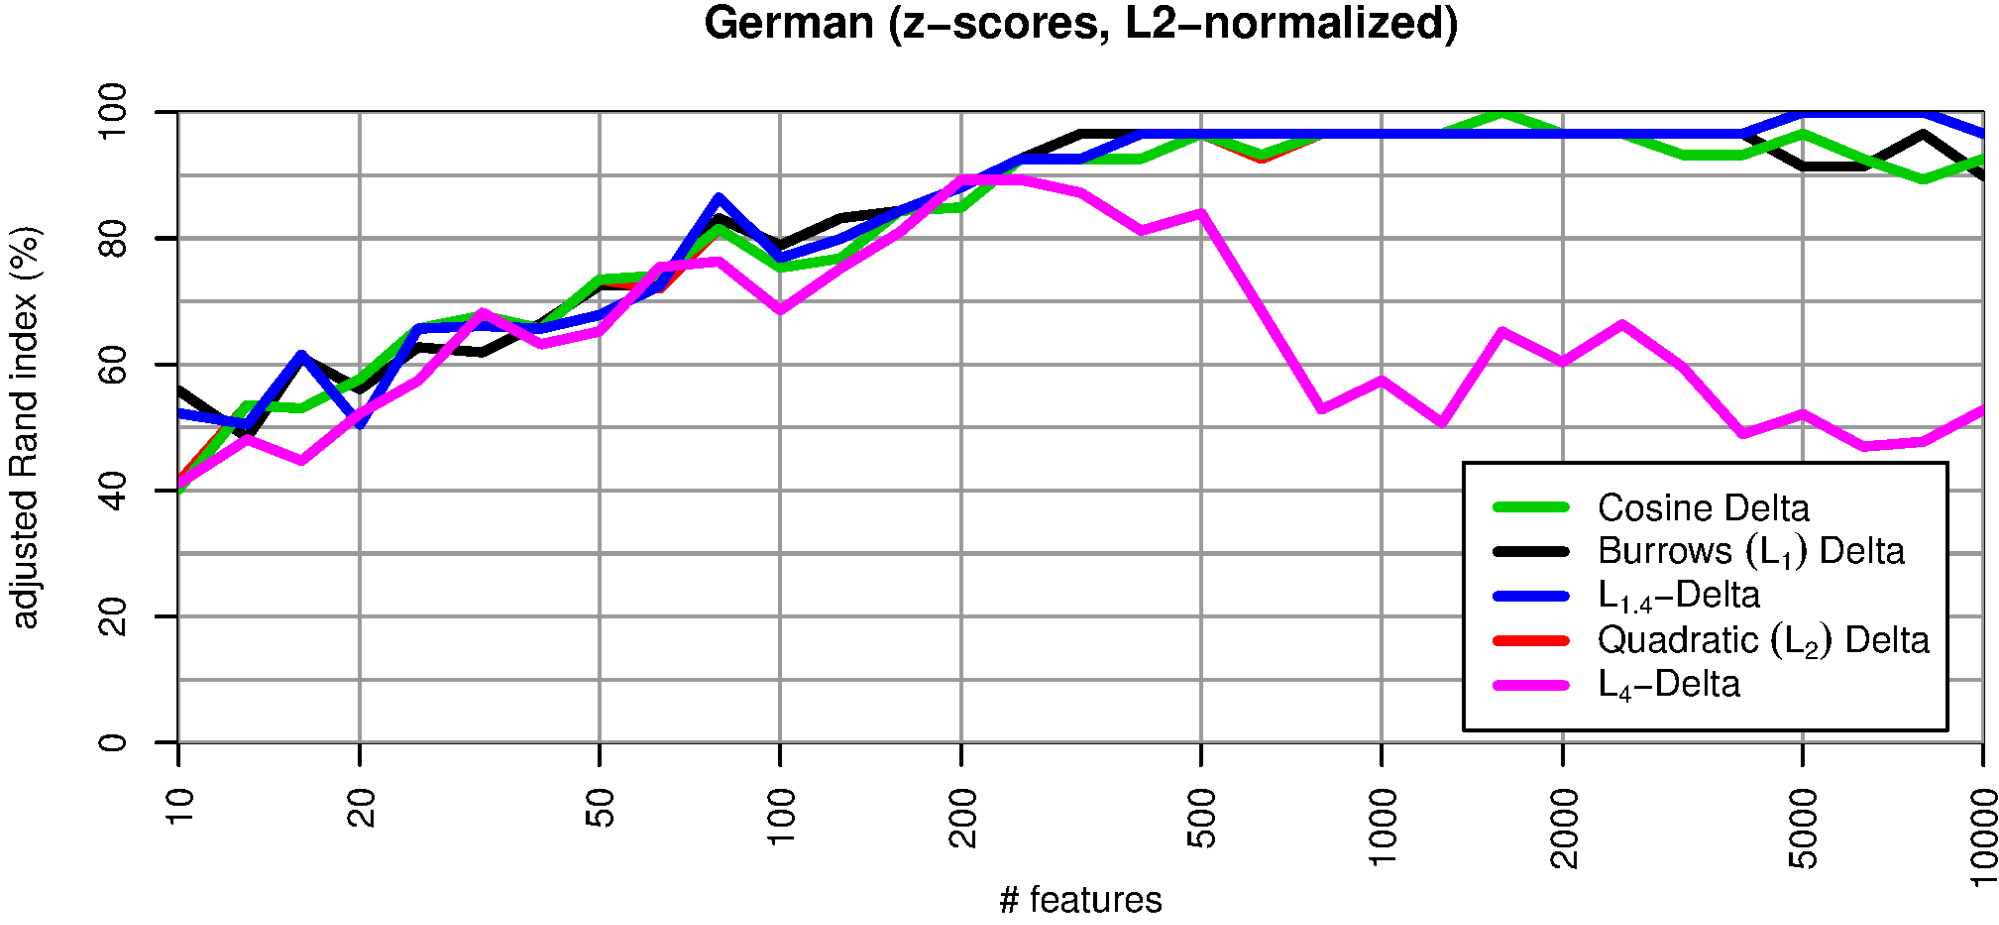
Normalizing the feature vectors to length 1 improves the quality of all Delta measures significantly (fig. 3). In this case, Argamon’s Delta Q is identical to Delta Cos: the red line is completely covered by the green one. The other Delta measures (Delta Bur, L 1.4-Delta) now reach about the same quality as Delta Cos. Only L 4 Delta, which is especially prone to outliers, falls short considerably. These results seem to support H1.
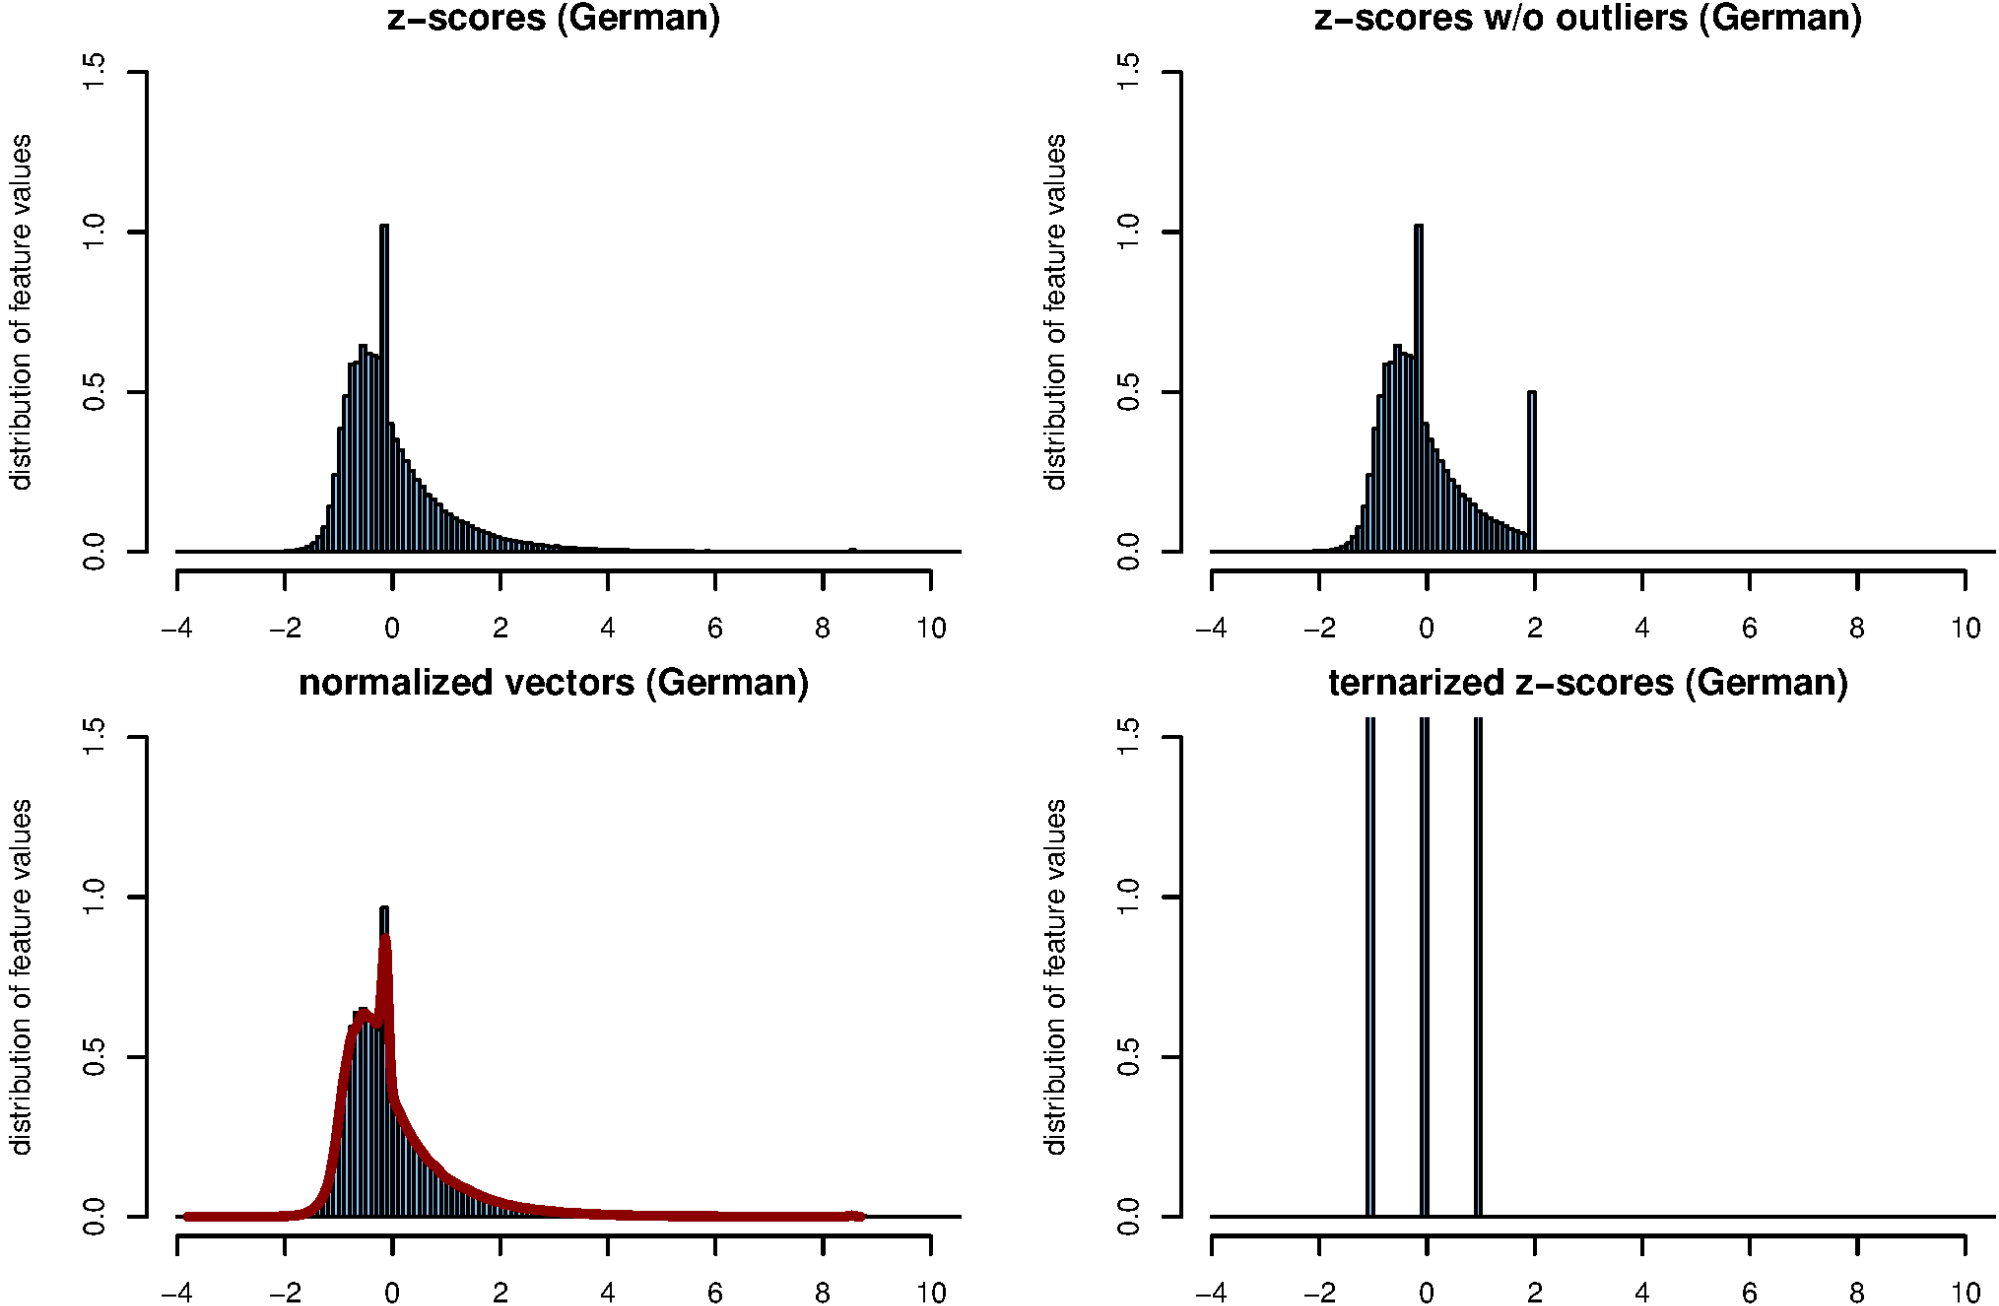
A different approach to limit the influence of outliers is to truncate extreme z-scores. To do so, we set all | z| > 2 to +2 or –2, depending on the original z-scores’s sign. Fig. 4 shows the effects of various normalizations on the distribution of the feature values. Vector length normalization (lower left) produces only slight changes and practically does not reduce the number of outliers at all. Pruning large z-score values only affects words with above-average frequencies (upper right).
As Fig. 5 shows, this manipulation improves the performance of all L p Deltas considerably. However, its positive effect is noticeably smaller than that of vector normalization.
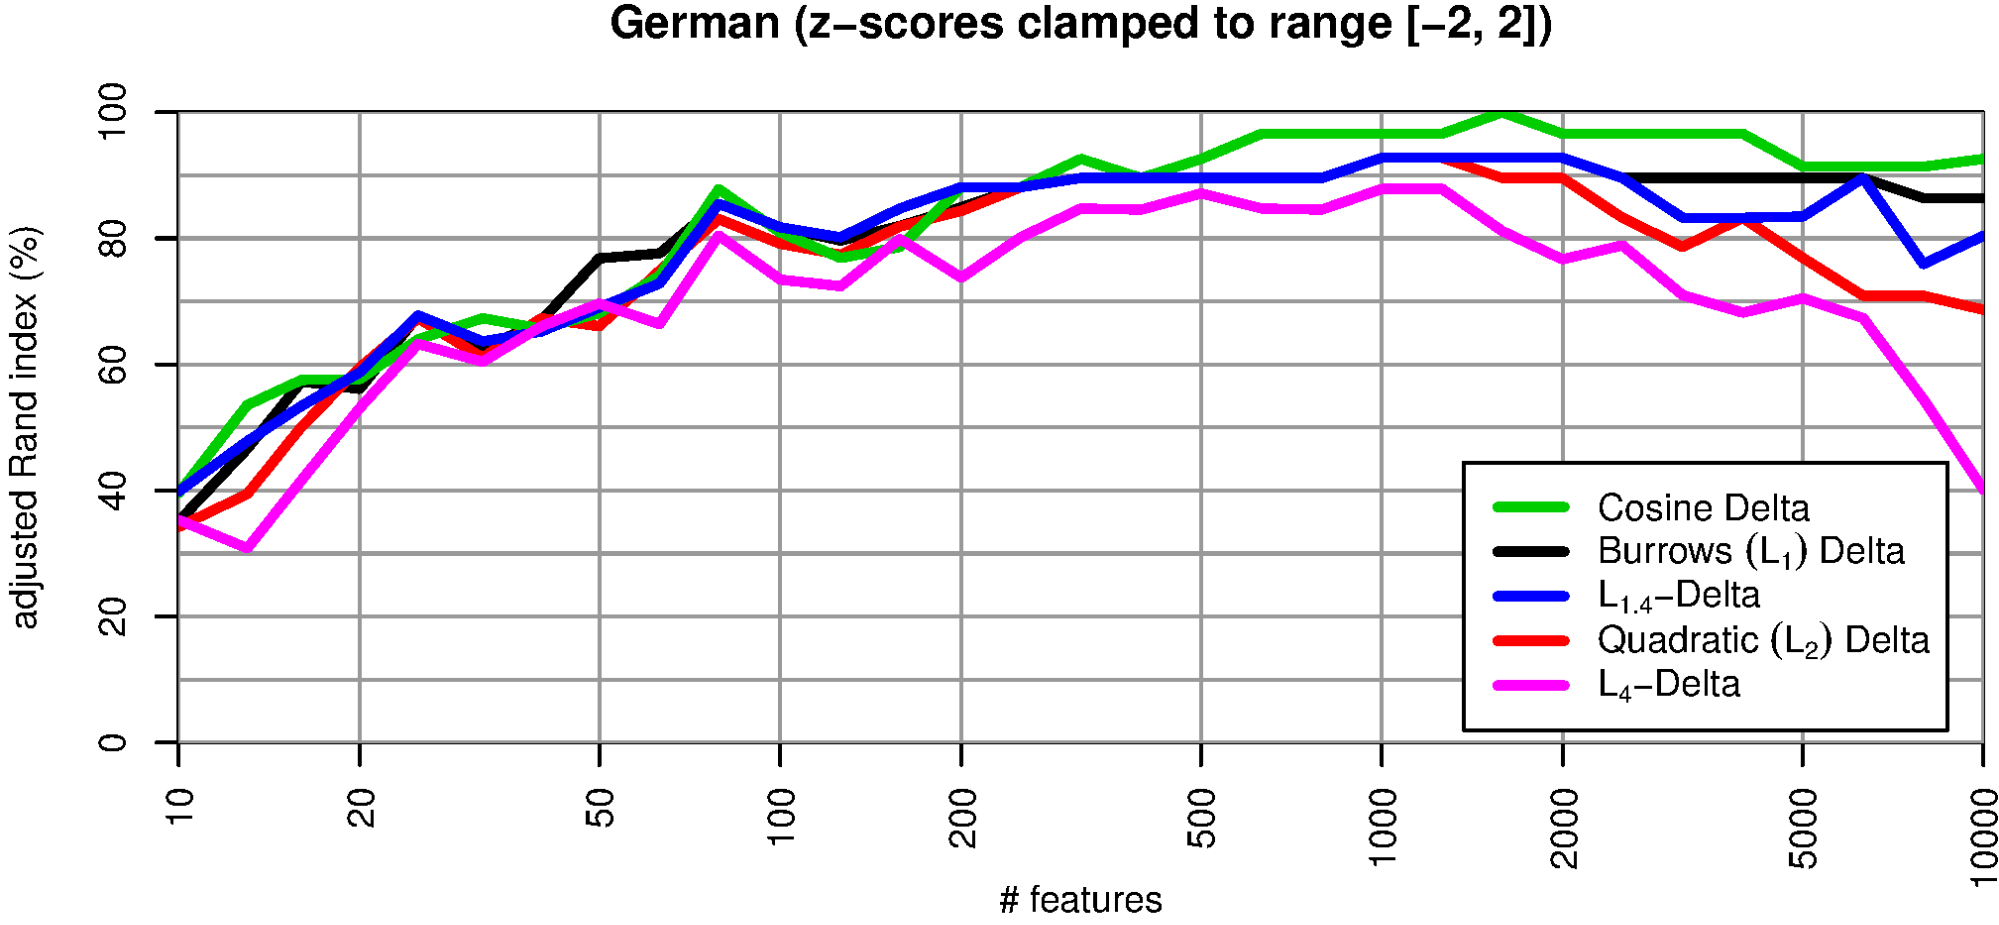
With these differing effects of the normalizations on outlier distributions and Delta results, H1 cannot be upheld. H2 is supported by the good results of vector length normalization. However, on its own, it cannot explain why clamping outliers leads to a considerable improvement as well. To examine this hypothesis further, we created pure “key profile” vectors that only discriminate between word frequencies that are above average (+1), unremarkable (0), and below average (–1; cf. Fig. 4, lower right).
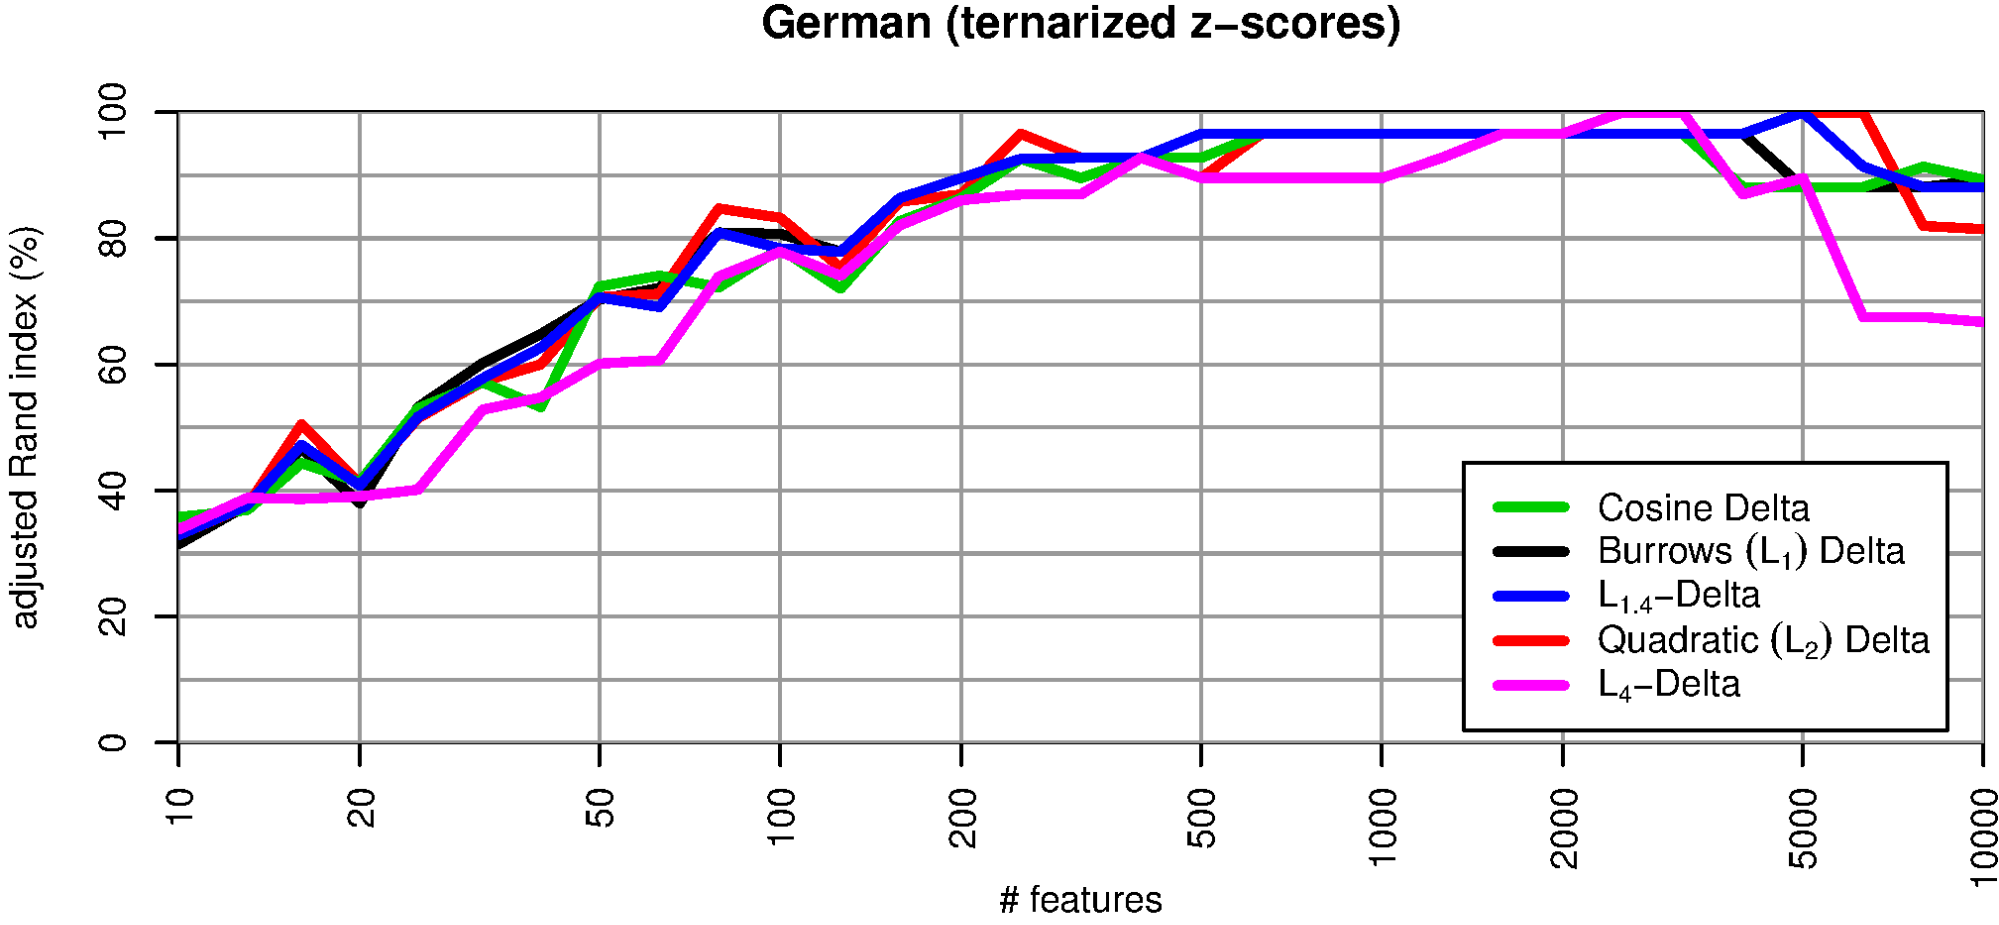
Fig. 6 shows that these key profile vectors perform remarkably well, almost on par with vector normalization. Even the especially outlier-prone L 4 Delta reaches a quite robust clustering quality of more than 90%. We interpret this observation as giving considerable support to hypothesis H2.
4. Discussion and perspectives
H1, the outlier hypothesis, has been disproven as the vector normalisation hardly reduces the number of extreme values and the quality of all L p measures is still considerably improved. On the other hand, H2, the key profile hypothesis, has been confirmed. The ternary quantification of the vectors shows clearly that it is not the extent of deviation resp. the size of the amplitude, but the profile of deviation across the MFW which is important. Remarkably, the measures behave differently if more than 2000 MFW are used. Almost all variant show a decline for a very large number of features, but they differ in when this decline starts. We suppose that the vocabulary in those parts is less specific for an author than for topics and content. Clarifying such questions will require further experiments.
- Argamon, S. (2008). Interpreting Burrows’s Delta: Geometric and Probabilistic Foundations. Literary and Linguistic Computing, 23(2): 131–47 doi:10.1093/llc/fqn003. http://llc.oxfordjournals.org/content/23/2/131.abstract.
- Baeza-Yates, R. and Ribeiro Neto, B. (1999). Baeza-Yates, Ricardo; Ribeiro Neto, Berthier (1999): Modern Information Retrieval. Harlow. Harlow.
- Burrows, J. (2002). ‘Delta’: a Measure of Stylistic Difference and a Guide to Likely Authorship. Literary and Linguistic Computing, 17(3): 267–87 doi:10.1093/llc/17.3.267. http://llc.oxfordjournals.org/content/17/3/267.abstract.
- Eder, M. and Rybicki, J. (2011). Deeper Delta across genres and languages: do we really need the most frequent words?. Literary and Linguistic Computing, 26(3): 315–21 doi:10.1093/llc/fqr031. http://llc.oxfordjournals.org/content/early/2011/07/14/llc.fqr031.abstract .
- Evert, S., Proisl, T., Pielström, S., Schöch, C. and Vitt, T. (2015). Towards a better understanding of Burrows’s Delta in literary authorship attribution. Proceedings of the Fourth Workshop on Computational Linguistics for Literature. Denver CO.
- Hoover, D. L. (2004). Testing Burrows’s Delta. Literary and Linguistic Computing, 19(4): 453–75 doi:10.1093/llc/19.4.453. http://llc.oxfordjournals.org/content/19/4/453.abstract.
- Jannidis, F., Pielström, S., Schöch, C. and Vitt, T. (2015). Improving Burrows’ Delta – An empirical evaluation of text distance measures. Digital Humanities 2015 Conference Abstracts. Sydney: ADHO http://dh2015.org/abstracts/xml/JANNIDIS_Fotis_Improving_Burrows__Delta___An_empi/JANNIDIS_Fotis_Improving_Burrows__Delta___An_empirical_.html.
- Smith, P. W. H. and Aldridge, W. (2011). Improving Authorship Attribution: Optimizing Burrows’ Delta Method. Journal of Quantitative Linguistics, 18(1): 63–88 doi:10.1080/09296174.2011.533591. http://www.tandfonline.com/doi/abs/10.1080/09296174.2011.533591.
