Authors: Maciej Eder, Rafał Górski
Category: Paper:Long Paper
Keywords: stylometry, language change, historical linguistics, language development
Historical Linguistics’ New Toys, or Stylometry Applied to the Study of Language Change
1. Background
In the last decades, quantitative linguistics (following exact and social sciences) has developed several statistical methods providing an insight into measurable phenomena of natural language. Although to a lesser extent, it also applies to the analysis of diachronic changes. Obviously, the so-called philological method in historical linguistics (unlike historical comparative and internal reconstruction methods) was always a kind of “corpus linguistics”, which means that a linguist studying a given period of a language investigated, via close reading, available written records. Consequently, the text was usually treated as a (mistrustful) informant. The implication of this attitude is that in principle, a single attestation of a linguistic fact in a text was considered a strong evidence. Paradoxically, it is synchronic corpus linguistics that changed the overly conservative approaches to diachrony. The most significant here is the shift from purely qualitative to quantitative argumentation. Certainly, the availability of machine-readable corpora allows for much more sophisticated quantitative analysis these days.
A significant drawback of many of the quantitative methods applied so far is a tacit assumption that the researcher knows in advance which elements of the language are subject to change. In other words: the method of, say, plotting and inspecting the trend for a given phenomenon may be applied only to verify hypotheses stipulated earlier by traditional (that is qualitatively oriented) diachronic linguistics. A real challenge, however, is to develop such a method that would allow to trace chronological change in the language without a prior knowledge which linguistic features are responsible for the change. Promising results may be expected using some of the stylometric techniques based on the statistical analysis of style, especially the so-called multidimensional methods. The combination of stylometry and historical linguistics is not an entirely new idea. The problem of automatic recognition of relative chronology of texts was recently addressed by Stamou (2008; 2009), Štajner and Mitkov (2011), Popescu and Strapparava (2013), Štajner and Zampieri (2013), Zampieri et al. (2015). We shall note, however, that the first who sought to solve the question of chronology of texts via their stylistic features was Lutosławski (1897).
Stylometric methods are particularly efficient when applied to frequencies of function words (or, the most frequent words). However, an interesting question arises what if we disregard words and examine grammatical features instead? Obviously, the usage of archaic vs. modern inflected forms alone will differentiate texts written in two distinct (yet still close) periods. What is less obvious, however, is whether processing solely POS-tags, i.e. grammatical labels, can show the dynamics of language change. Note that the sequences of POS-tags are a good approximation of syntax, even if they cannot replace parsing (Hirst and Feiguina, 2007; Wiersma et al., 2011). To scrutinize the above research question, we performed a number of stylometric tests using different (tailored) methods and different combinations of lexical and grammatical features’ n-grams.
2. Chronology at a glance
Standard stylometric methods are aimed at tracing differences between (groups of) texts. They proved to be successful in detecting a predominant stylistic signal, which in most cases is the authorial voice. However, when the number of analyzed texts is high enough, the emerging authorial groups (clusters) tend to form larger lumps reflecting the existence of other stylometric signals, such as genre, gender or chronology. This phenomenon can be observed very clearly when bootstrap consensus network – an enhanced version of cluster analysis (Eder, 2015) – is applied.
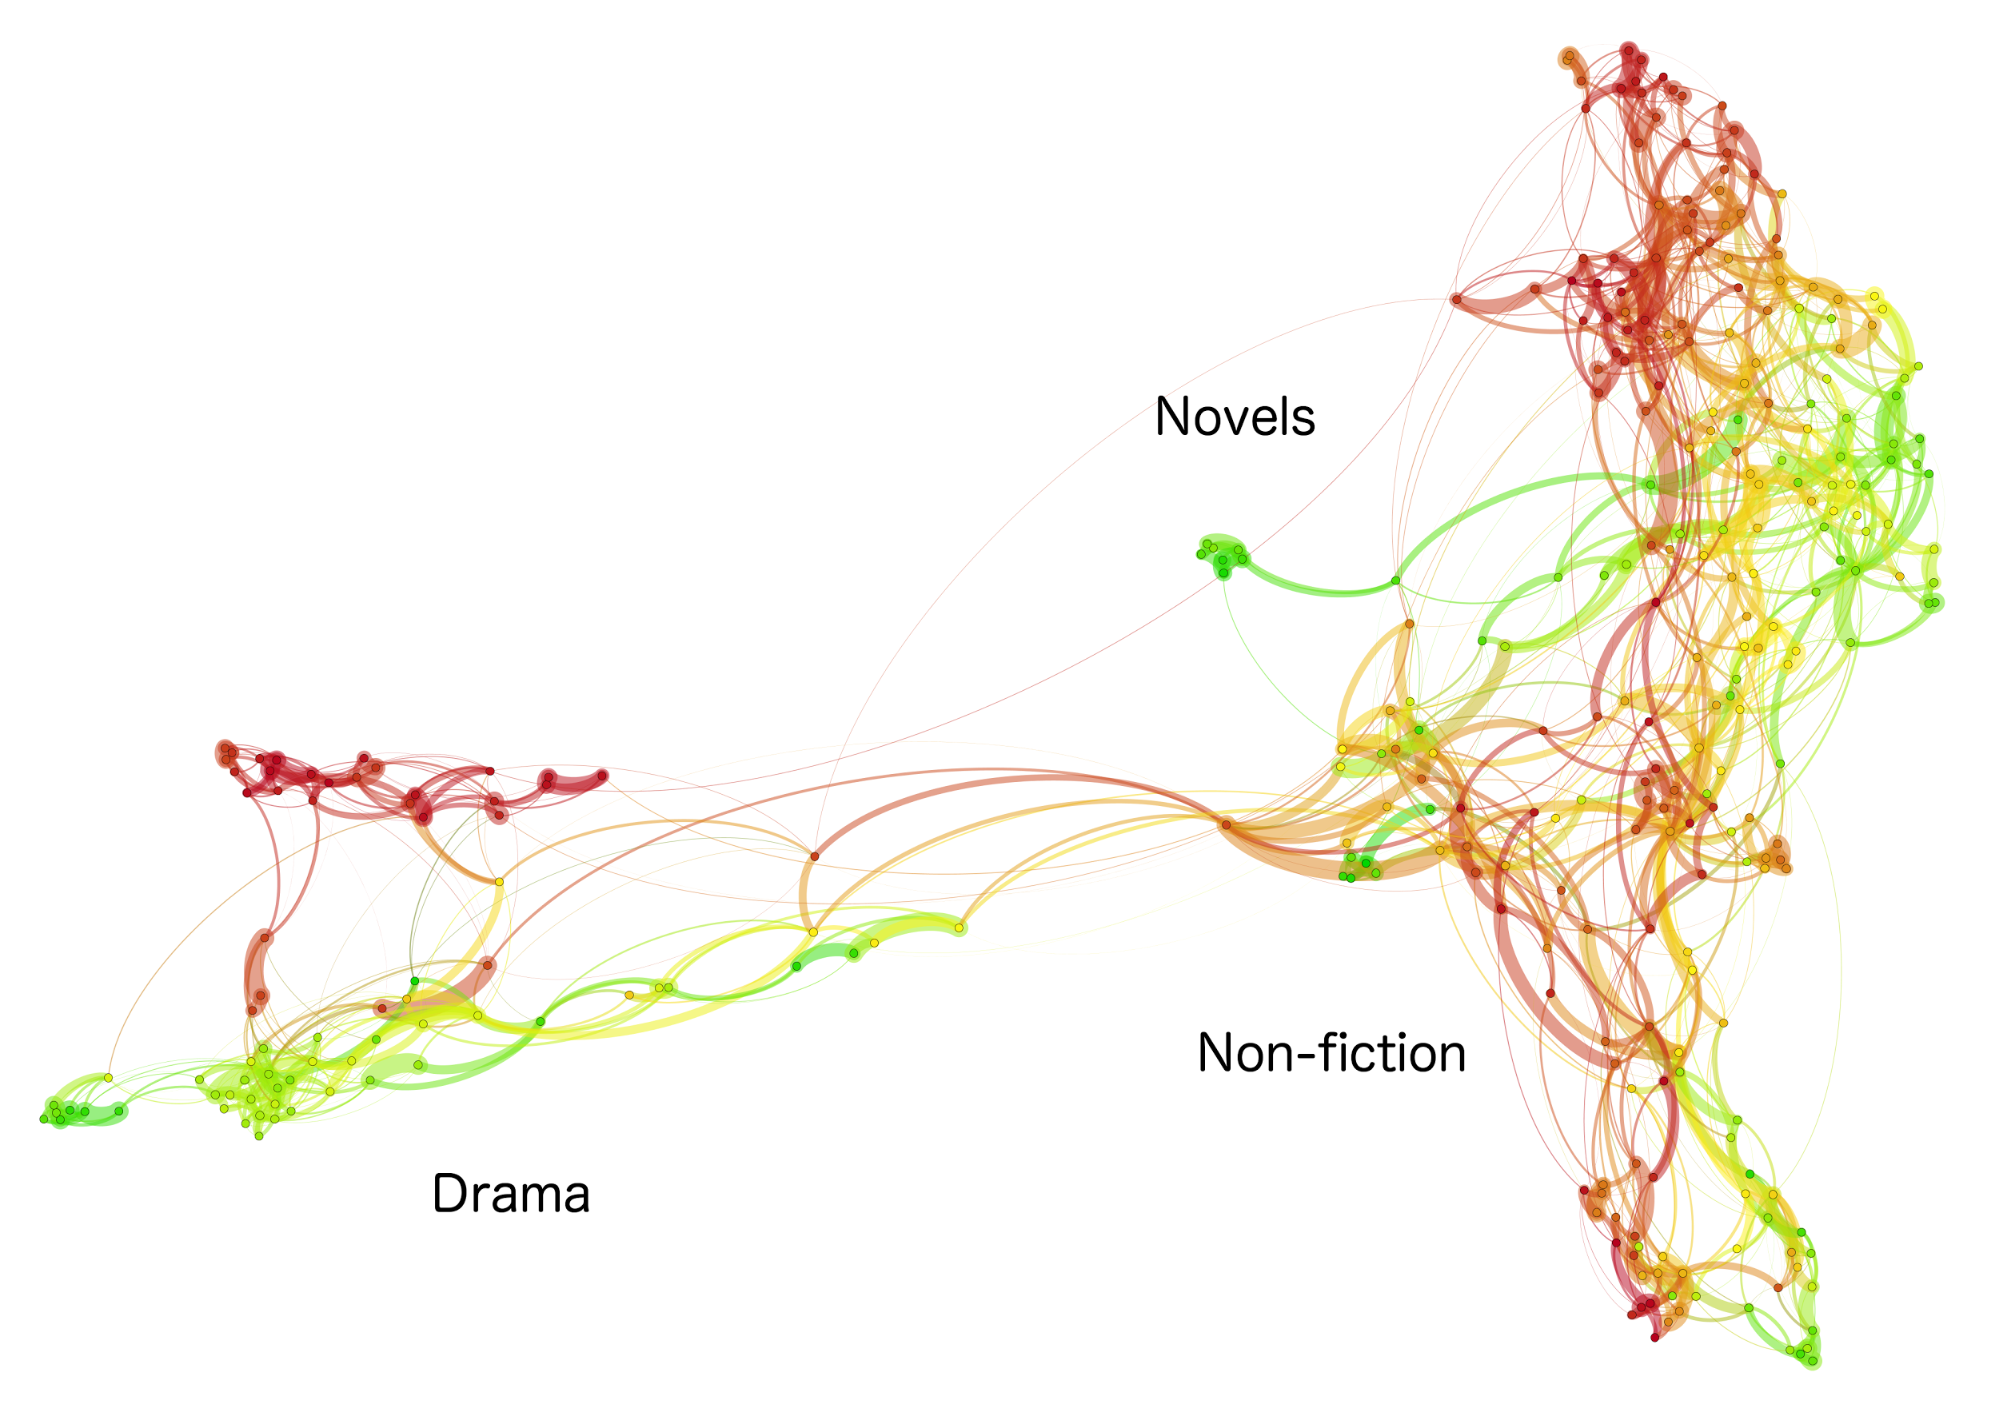
In Fig. 1, a network of an exemplary corpus of 333 English texts (De Smet, 2005) covering the period 1700–1930 is shown. The network was produced using most frequent words as predictors. One can notice a clear split into three distinct areas of the network that is due to a strong genre signal. However, despite the overwhelming division into novels, non-fiction, and drama, an additional chronological signal – represented by a transition from green (the earliest works) to red (the latest works) is fairly noticeable within each of the three sub-groups. Networks for other style markers (word n-grams, POS-tag n-grams) showed a similar behavior.
3. Modeling stylistic drifts
Certainly, the general picture revealed by the above network is by no means satisfactory, at least from the perspective of historical linguists. In particular, one would like to know how to pinpoint the observed chronological transition, in terms of identifying interpretable trends and/or breaks. The idea discussed in this section addresses this problem by combining multivariate stylometry with linear regression models.
Multidimensional scaling is a way of compressing (or projecting) a highly complex space into its simpler, usually two-dimensional, representation. Even if such a procedure always involves some loss of information, it is believed to reveal actual differences between samples. Now, since the technique allows to reduce the original space into an arbitrary number of dimensions, one can squeeze the data into just one dimension. This single MDS score can be plotted against the timeline, in order to test if any correlation between the two variables exist. The more diagonal is the shape of the plotted points, the higher the correlation.
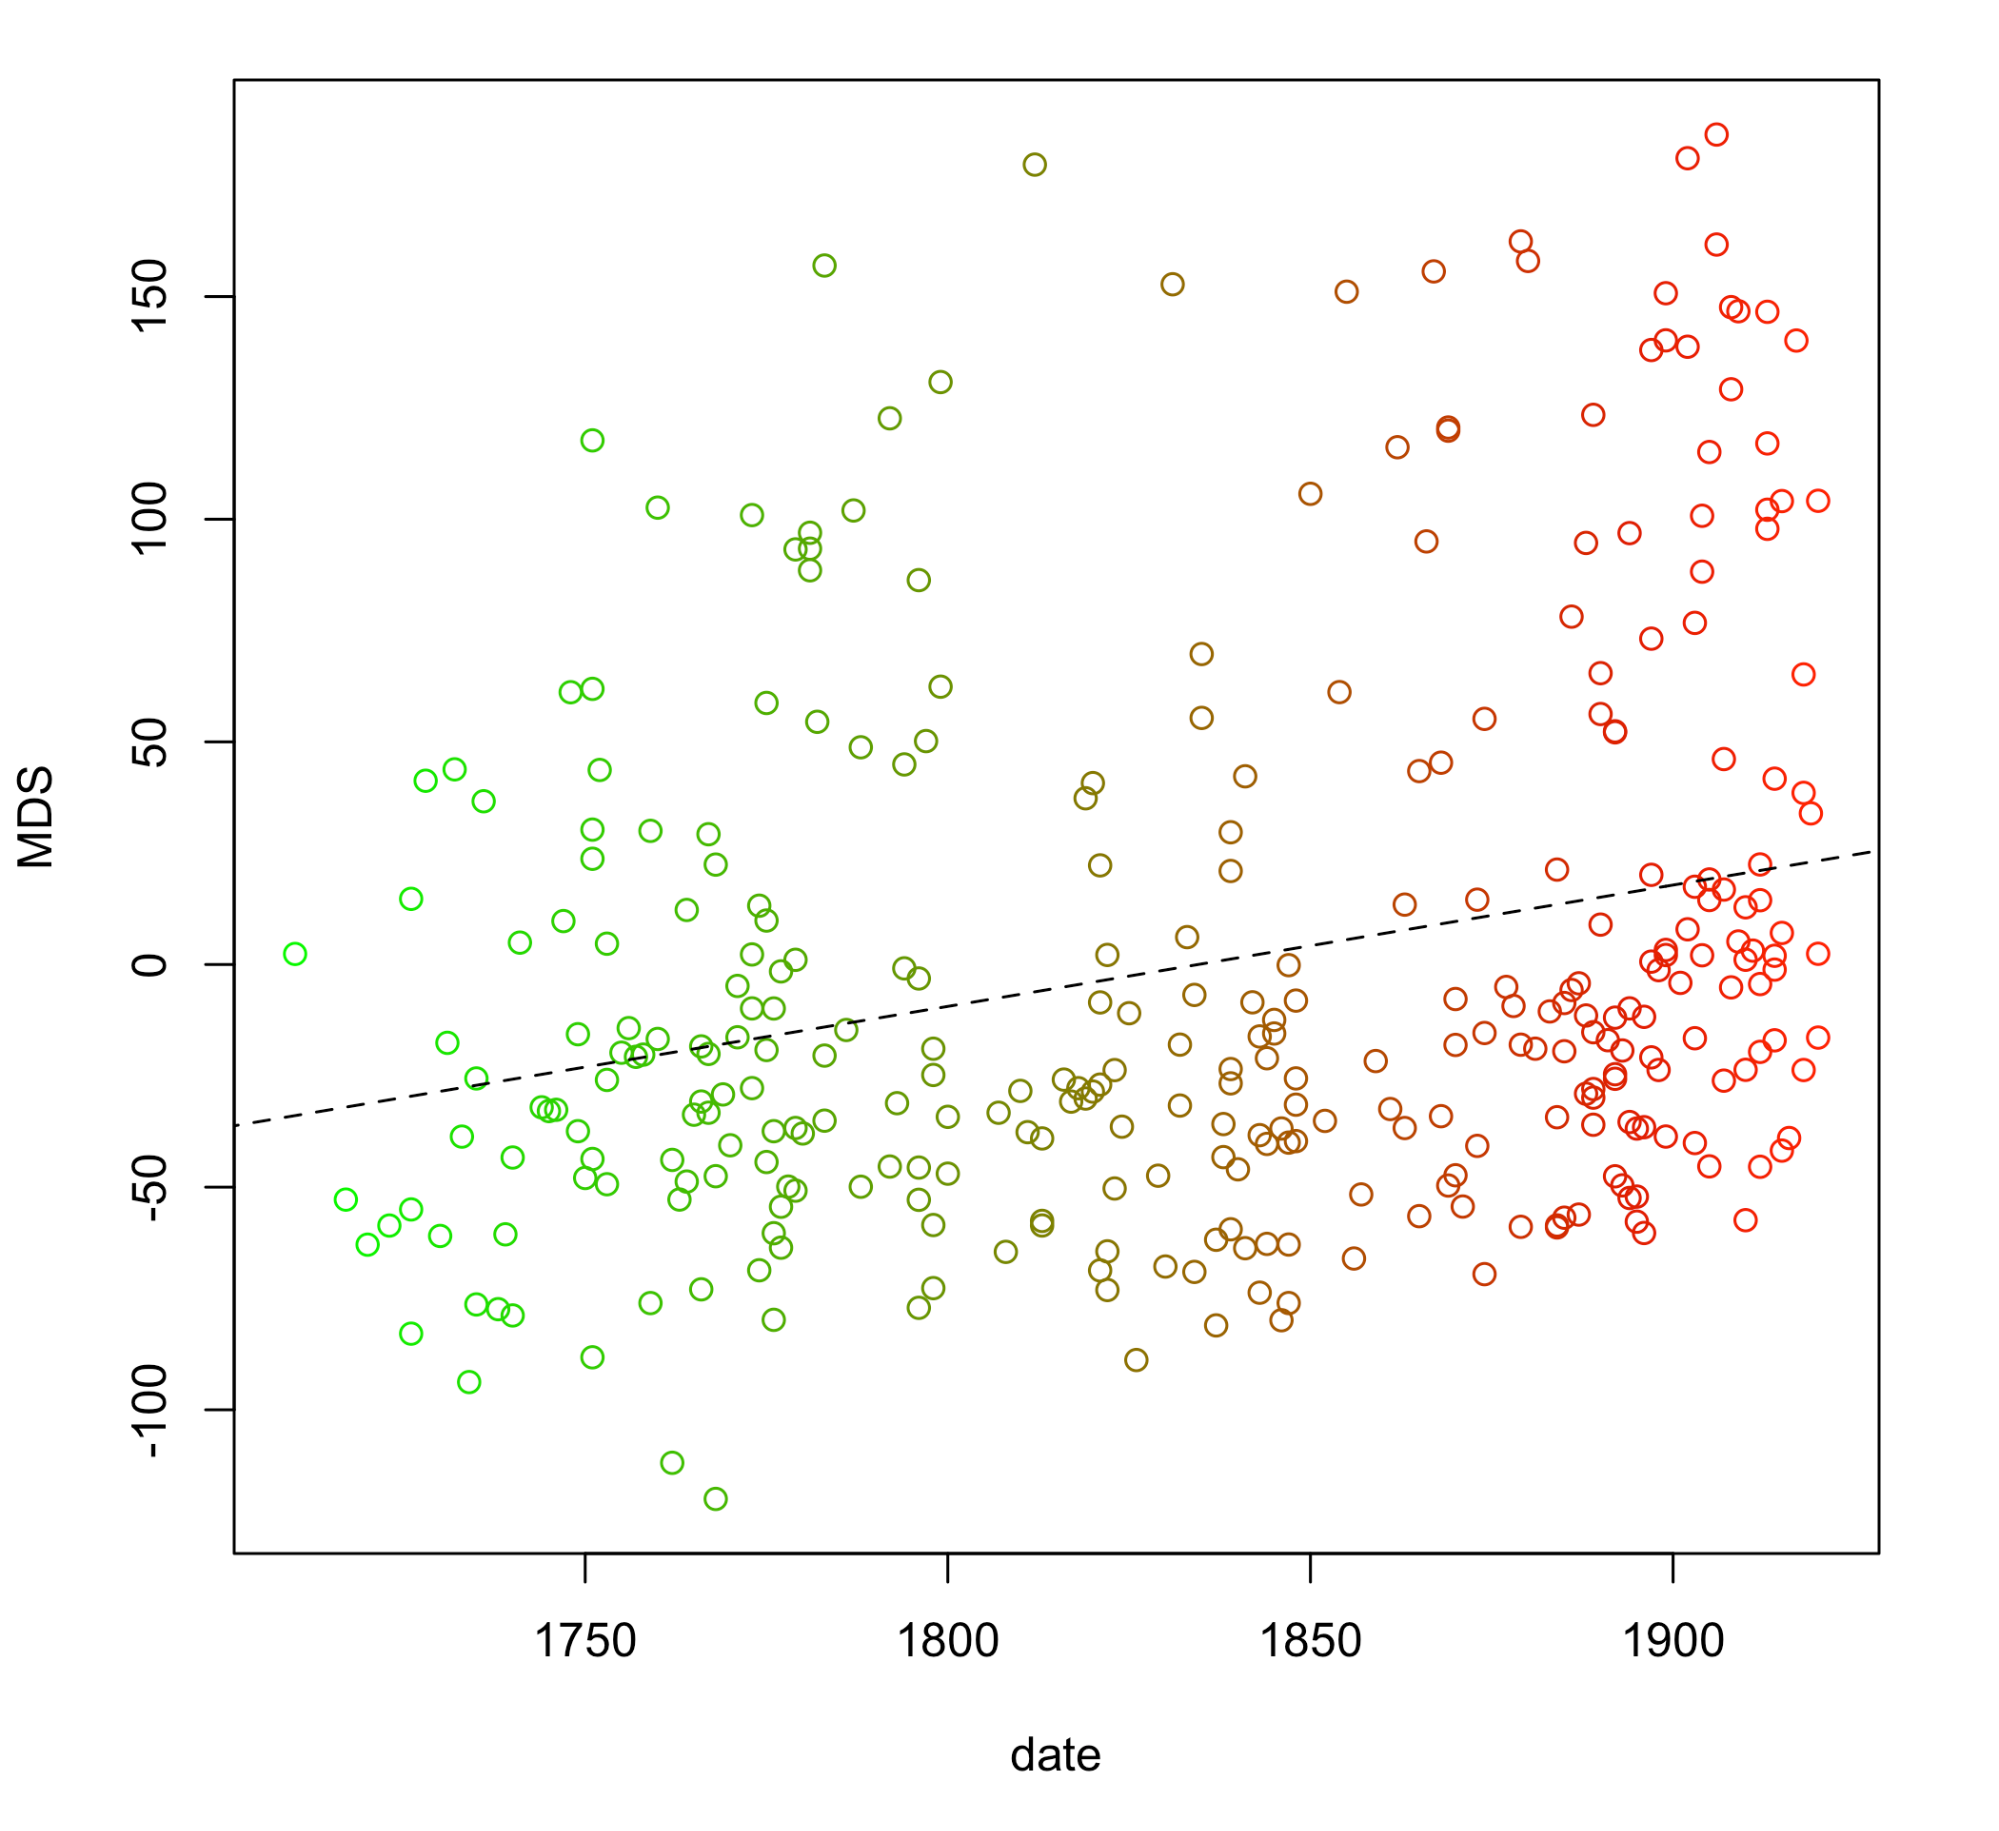
In Fig. 2, some correlations between the timeline and the MDS values are fairly visible with a naked eye. However, when the results are scrutinized using a standard linear regression model y i = x i β 1 + β 0 + ε (where β 1 and β 0 are parameters of the model, and ε is a random effect), their correlations become even more obvious. The estimated model (a dashed line in Fig. 2), is formulized as ŷ i = 0.272 * d i – 499.94 + ε, where d i denotes the i-th text’s date of publication. In terms of the p value, the model is statistically significant ( p < 0.01); however, the goodness of fit as represented by the adjusted R 2 value is rather poor ( R 2 = 0.06), due to the overwhelming genre signal hidden in the dataset. When one splits the corpus into three genres and analyzes them separately, however, the explanatory power of the model is far higher.
4. Supervised classification and the timeline
One of the most interesting aspects of language development – overlooked in a vast majority of the existing studies – is the question of the dynamics of linguistic changes. Presumably, one should expect epochs of substantial stylistic drift followed by periods of stagnation, rather than purely linear trends.
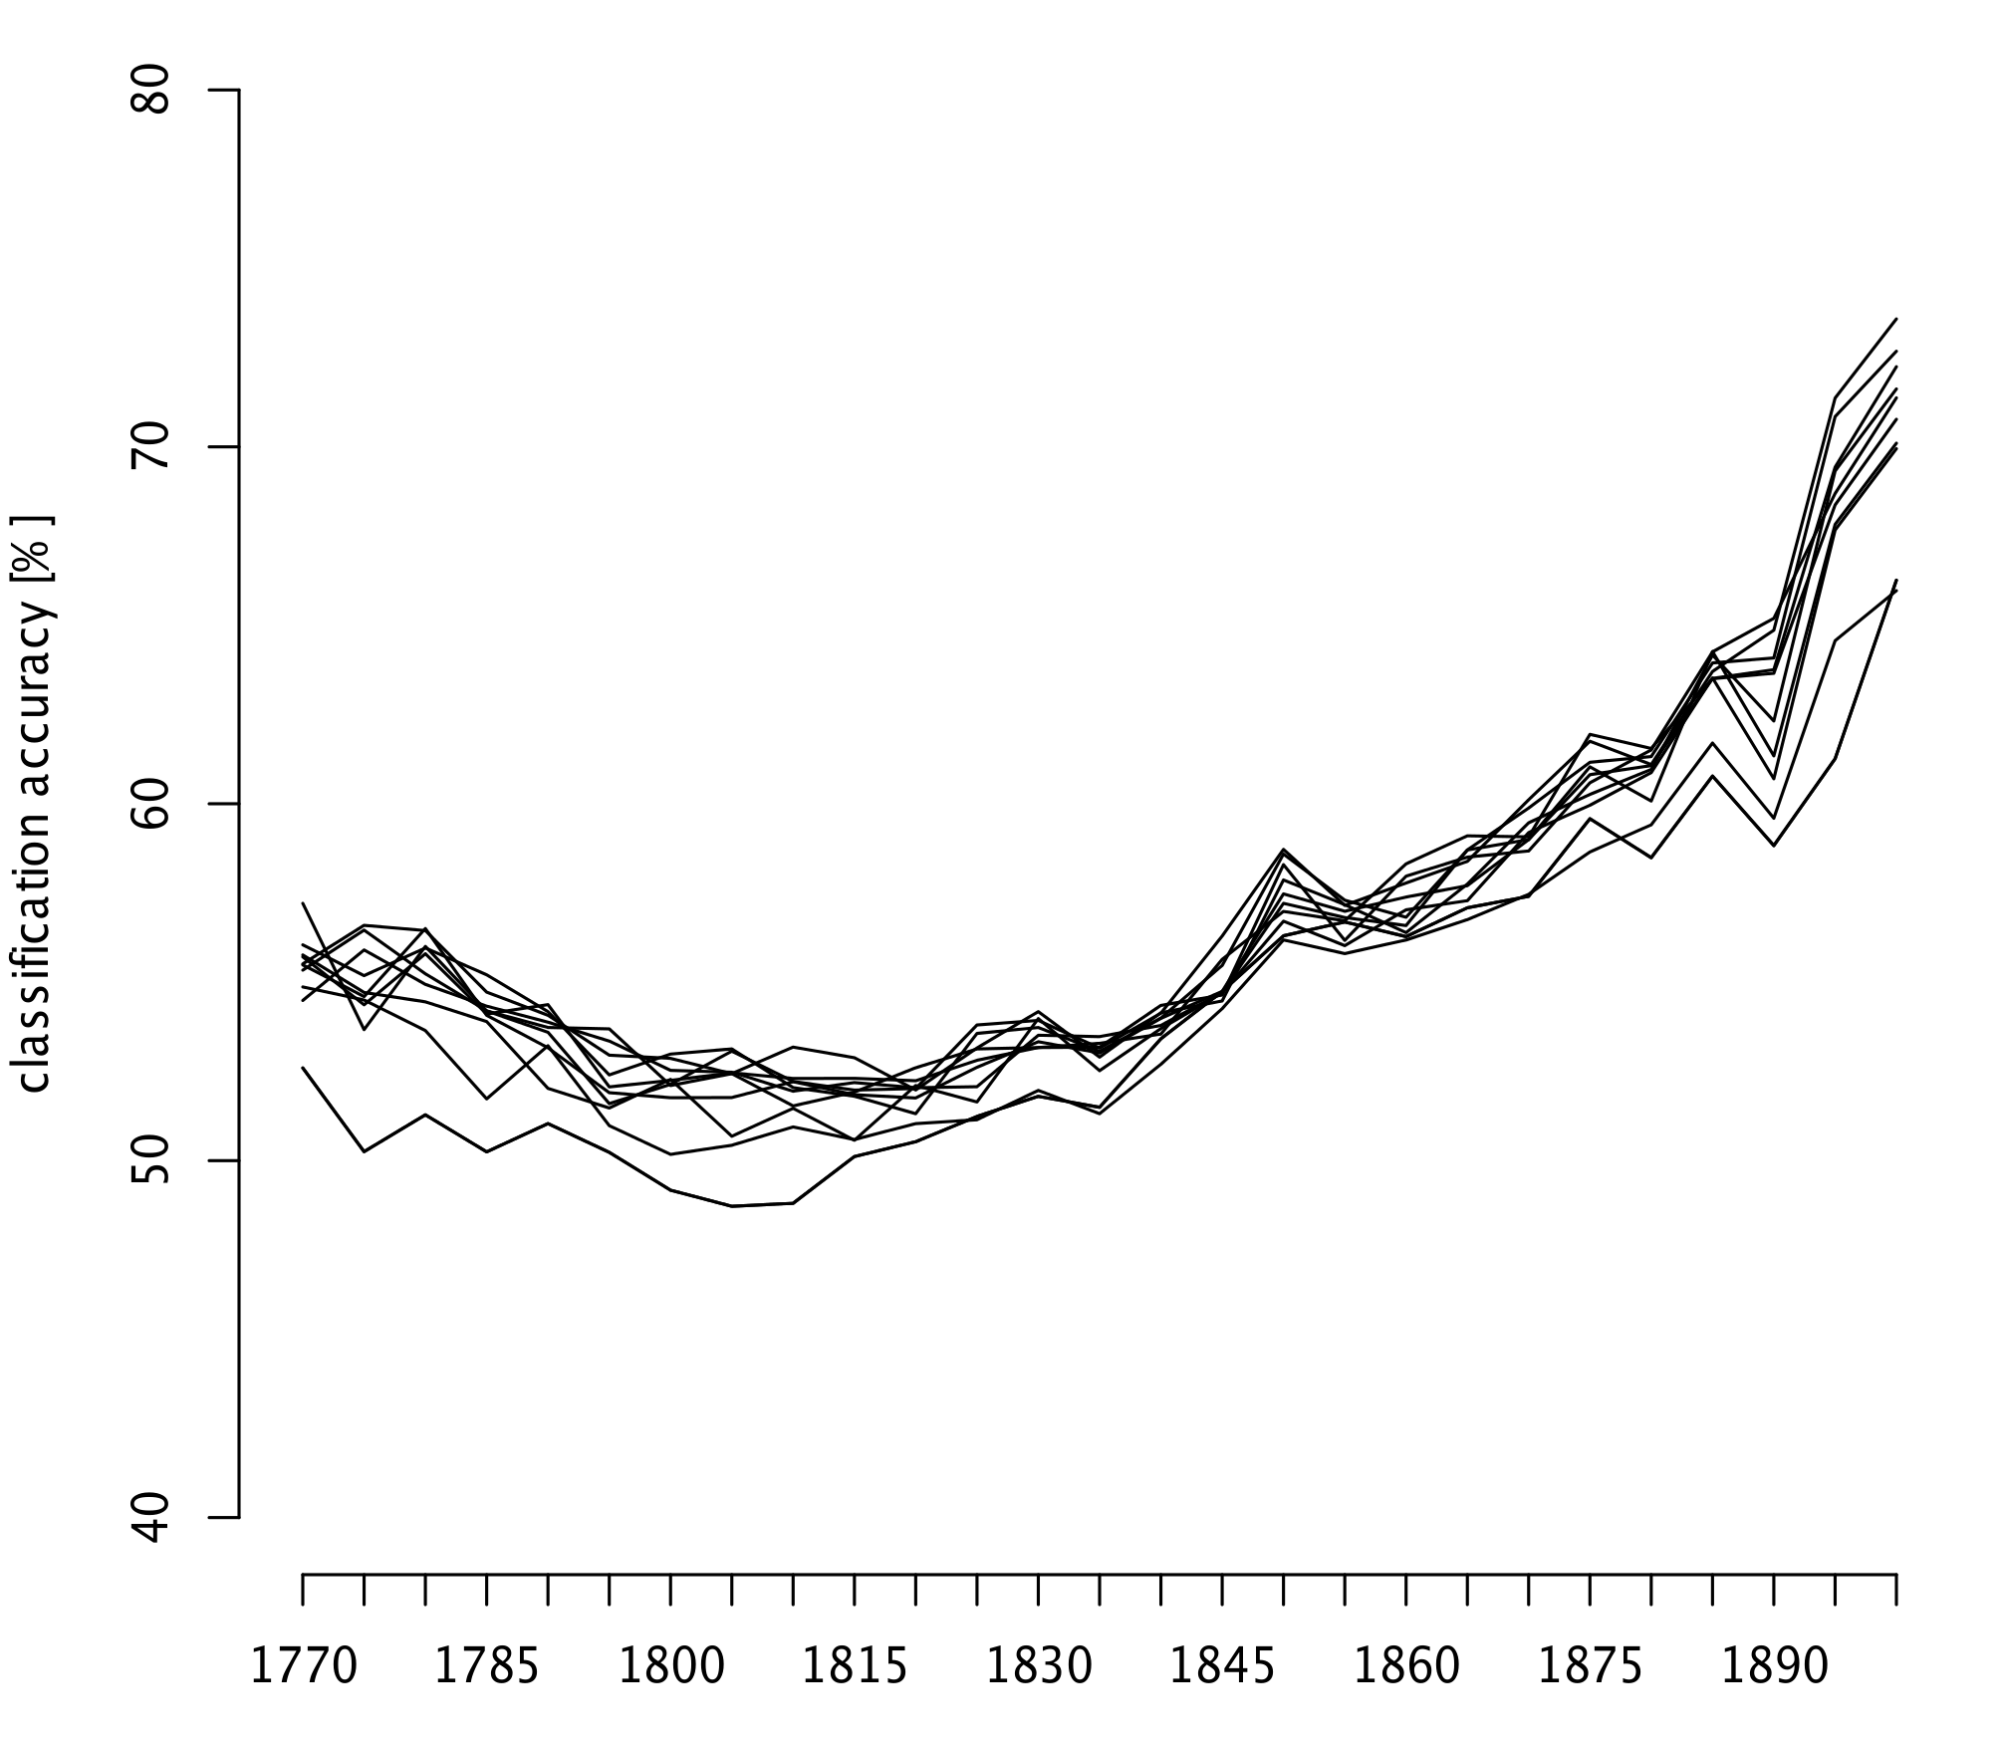
To assess this issue, we apply an iterative procedure of automatic text classification. First, we formulate a working hypothesis that a certain year – be it 1750 – marks a major linguistic break. We divide the text samples into the ante and post subsets, according to particular texts’ publication date. Next, we randomly pick a number of train and test samples representing the both classes ( ante and post), and we train a supervised classifier. We perform a standard classification, and record the cross-validated accuracy rates. Then we dismiss the original hypothesis, in order to test new ones: we iterate over the timeline, testing the years 1755, 1760, 1765, 1770, ... for their discriminating power. The assumption is simple here: any acceleration of linguistic change will be reflected by higher accuracy scores.
In Fig. 3, the classification accuracy rates for the aforementioned corpus of 333 English texts were shown (POS-tag 2-grams, NSC classifier). As one can observe, the scores obtained for the period 1750–1850 are only slightly higher than the baseline, betraying no revolutionary changes in this period. Later, however, the stylistic drift accelerates, reaching 70% of correctly recognized test samples.
5. Conclusions
in this paper we used a set of tailored stylometric methods to assess the question of language change over time. Our chosen techniques proved to be useful indeed; the further research will focus on tracing the very linguistic features that were responsible for the observed change. However, an important question has to be asked here: is it a change of Saussurean langue what we track with our approach, or rather the change of parole. Obviously, if texts written earlier can be separated from texts written more recently, they must share some features common for a given stage of language development. However, it is not clear if an observed change is due to, say, literary taste of the epoch or, if we face an actual change in the system here. Theoretically, the former and the latter are possible, as well as both answers together. It is also very likely that the change takes place in between: in the norm in the sense proposed by Coseriu (1958). Still there are no means to answer this question with any stylometric method, what for a linguist might be seen as a drawback. However, the proposed method informs the linguist about the fact of change, which takes place not only in lexis but also in syntax; about the speed of change and, above all, about the points where this speed accelerates.
6. Acknowledgements
This research is part of project UMO-2013/11/B/HS2/02795, supported by Poland’s National Science Centre.
- De Smet, H. (2005). A corpus of Late Modern English texts. International Computer Archive of Modern and Medieval English, 29: 69–82.
- Eder, M. (2015). Visualization in stylometry: cluster analysis using networks. Digital Scholarship in the Humanities, 30, first published online 3 December 2015, doi: 10.1093/llc/fqv061.
- Hirst, G. and Feiguina, O. (2007). Bigrams of syntactic labels for authorship discrimination of short texts. Literary and Linguistic Computing, 22(4): 405–17.
- Lutosławski, W. (1897). The Origin and Growth of Plato’s Logic: With an Account of Plato’s Style and of the Chronology of His Writings. London: Longmans, Green and Company.
- Popescu, O. and Strapparava, C. (2013). Behind the times: Detecting epoch changes using large corpora. International Joint Conference on Natural Language Processing. pp. 347–55 http://anthology.aclweb.org/I/I13/I13-1040.pdf (accessed 25 November 2015).
- Štajner, S. and Mitkov, R. (2011). Diachronic stylistic changes in British and American varieties of 20th century written English language. Proceedings of the Workshop on Language Technologies for Digital Humanities and Cultural Heritage at RANLP. pp. 78–85 http://www.anthology.aclweb.org/W/W11/W11-41.pdf#page=88 (accessed 25 November 2015).
- Štajner, S. and Zampieri, M. (2013). Stylistic changes for temporal text classification. Text, Speech, and Dialogue. Springer, pp. 519–26 http://link.springer.com/chapter/10.1007/978-3-642-40585-3_65 (accessed 25 November 2015).
- Stamou, C. (2008). Stylochronometry: stylistic development, sequence of composition, and relative dating. Literary and Linguistic Computing, 23(2): 181–99.
- Stamou, C. (2009). Dating Victorians. VDM Publishing.
- Wiersma, W., Nerbonne, J. and Lauttamus, T. (2011). Automatically extracting typical syntactic differences from corpora. Literary and Linguistic Computing, 26(1): 107–24.
- Zampieri, M., Ciobanu, A. M., Niculae, V. and Dinu, L. P. (2015). AMBRA: A Ranking Approach to Temporal Text Classification. Proceedings of the 9th International Workshop on Semantic Evaluation (SemEval 2015). Denver, pp. 851–55 http://www.researchgate.net/profile/Marcos_Zampieri/publication/273769693_AMBRA_A_Ranking_Approach_to_Temporal_Text_Classification/links/550c14850cf2b2450b4e901e.pdf (accessed 25 November 2015).